


COMPOSITION
-
Photography basics: Camera Aspect Ratio, Sensor Size and Depth of Field – resolutions
Read more: Photography basics: Camera Aspect Ratio, Sensor Size and Depth of Field – resolutionshttp://www.shutterangle.com/2012/cinematic-look-aspect-ratio-sensor-size-depth-of-field/
http://www.shutterangle.com/2012/film-video-aspect-ratio-artistic-choice/


-
HuggingFace ai-comic-factory – a FREE AI Comic Book Creator
Read more: HuggingFace ai-comic-factory – a FREE AI Comic Book Creatorhttps://huggingface.co/spaces/jbilcke-hf/ai-comic-factory

this is the epic story of a group of talented digital artists trying to overcame daily technical challenges to achieve incredibly photorealistic projects of monsters and aliens

-
Christopher Butler – Understanding the Eye-Mind Connection – Vision is a mental process
Read more: Christopher Butler – Understanding the Eye-Mind Connection – Vision is a mental processhttps://www.chrbutler.com/understanding-the-eye-mind-connection
The intricate relationship between the eyes and the brain, often termed the eye-mind connection, reveals that vision is predominantly a cognitive process. This understanding has profound implications for fields such as design, where capturing and maintaining attention is paramount. This essay delves into the nuances of visual perception, the brain’s role in interpreting visual data, and how this knowledge can be applied to effective design strategies.
This cognitive aspect of vision is evident in phenomena such as optical illusions, where the brain interprets visual information in a way that contradicts physical reality. These illusions underscore that what we “see” is not merely a direct recording of the external world but a constructed experience shaped by cognitive processes.
Understanding the cognitive nature of vision is crucial for effective design. Designers must consider how the brain processes visual information to create compelling and engaging visuals. This involves several key principles:
- Attention and Engagement
- Visual Hierarchy
- Cognitive Load Management
- Context and Meaning


DESIGN


COLOR
-
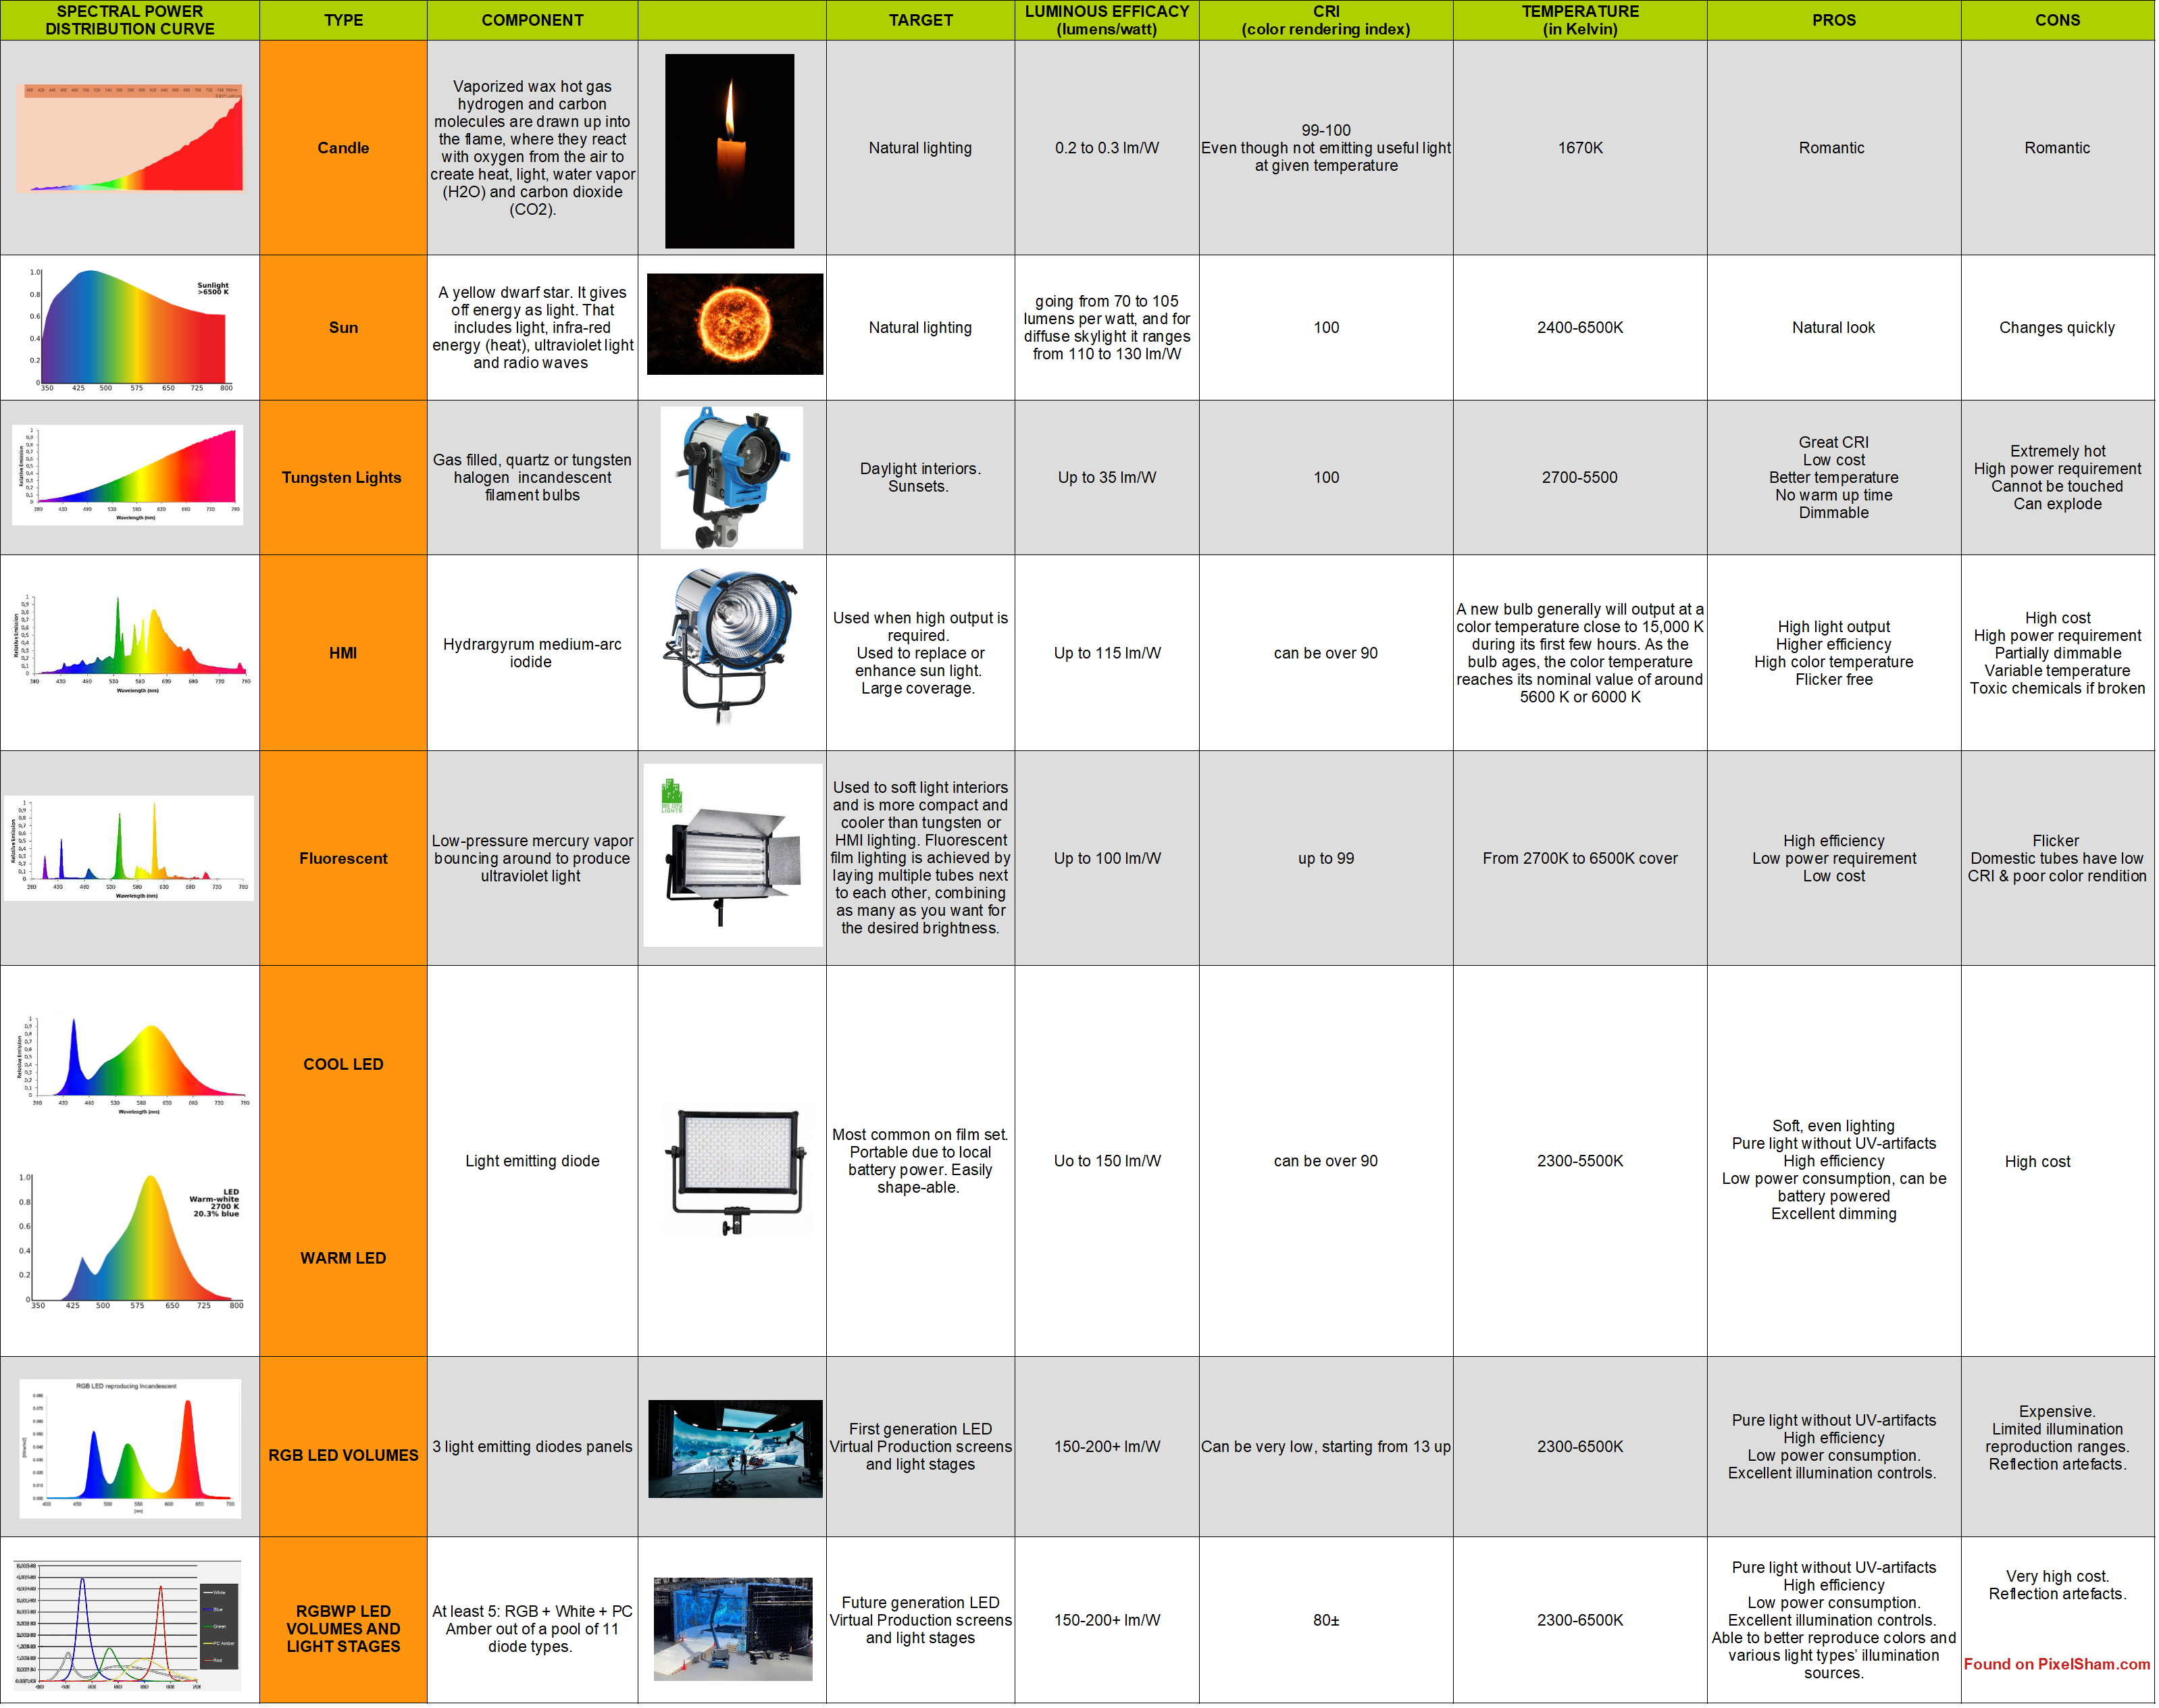
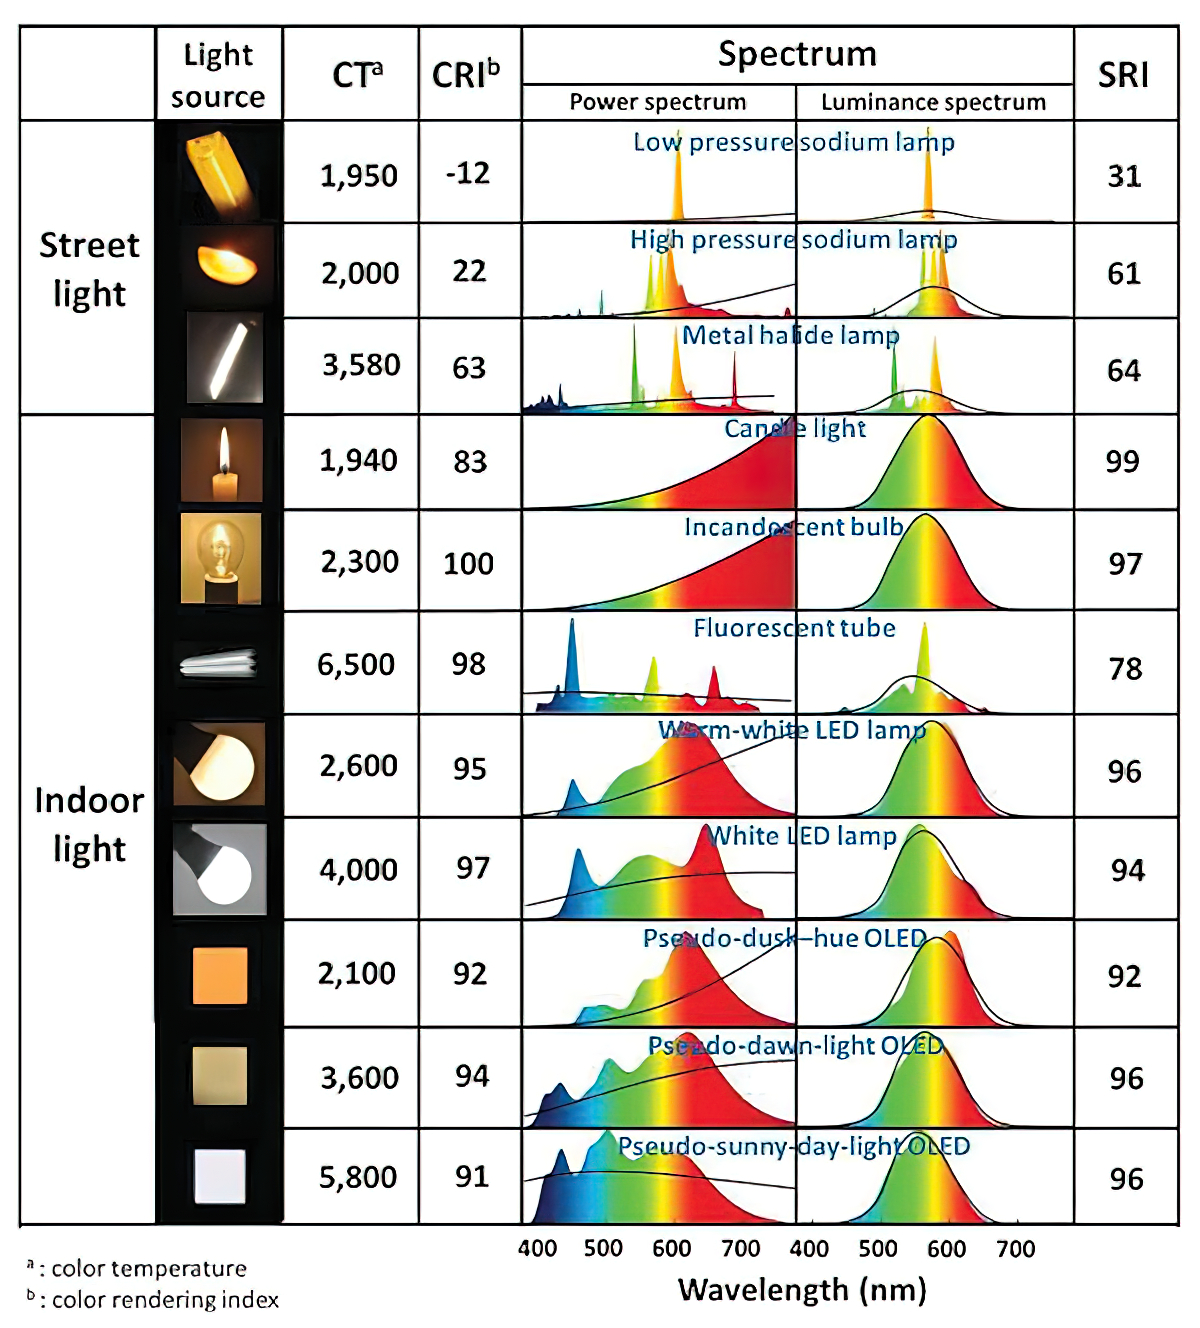
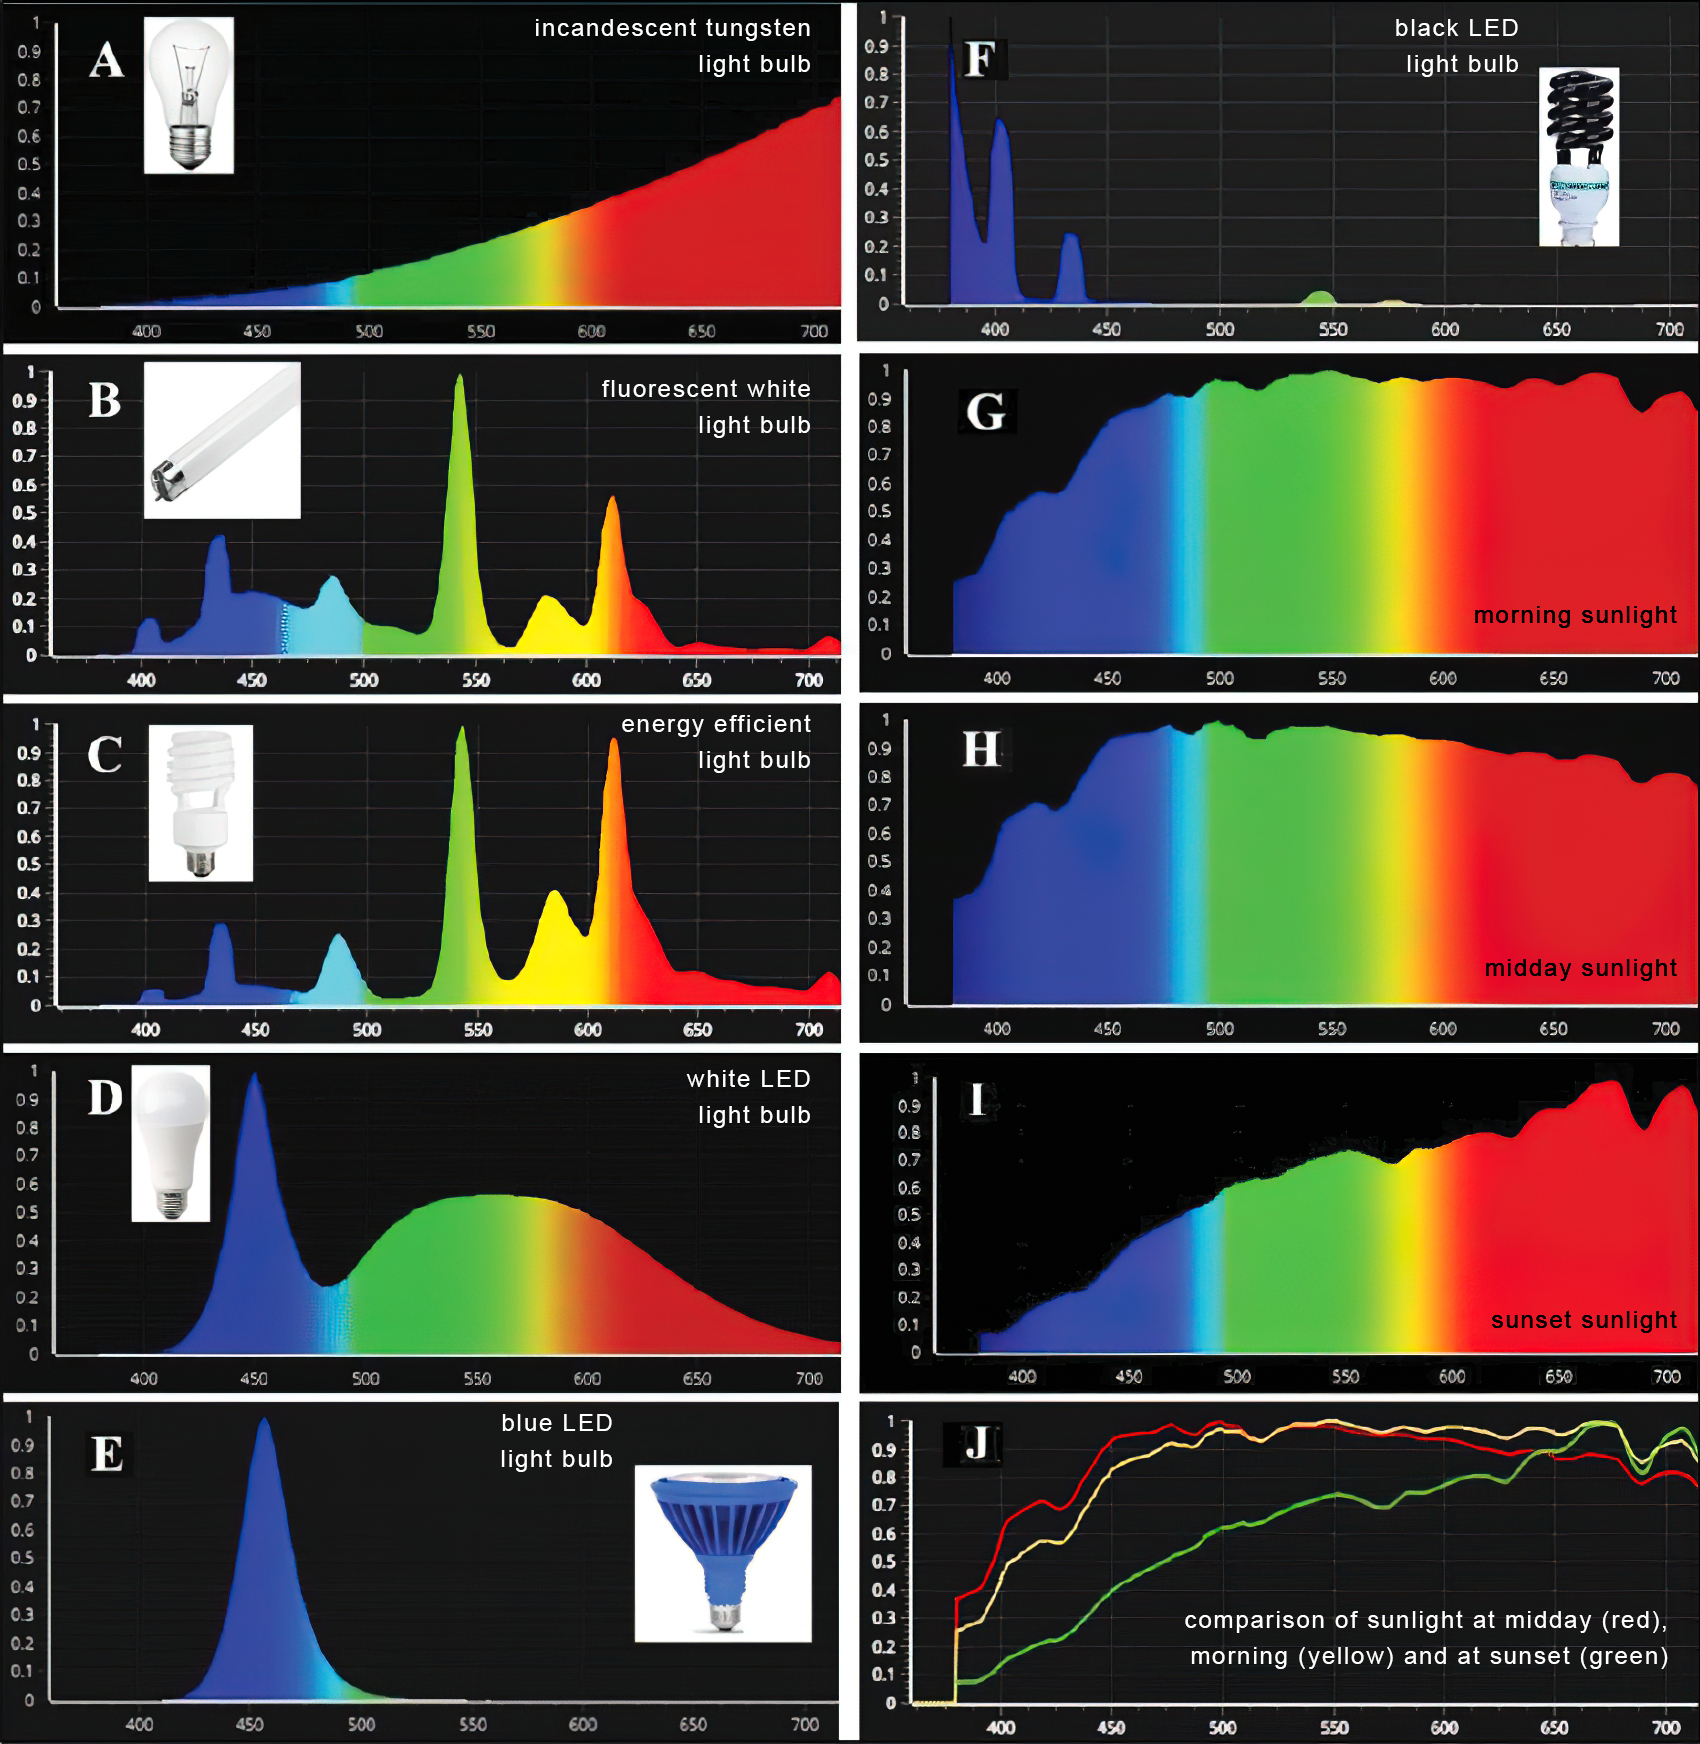
Types of Film Lights and their efficiency – CRI, Color Temperature and Luminous Efficacy
Read more: Types of Film Lights and their efficiency – CRI, Color Temperature and Luminous Efficacynofilmschool.com/types-of-film-lights
“Not every light performs the same way. Lights and lighting are tricky to handle. You have to plan for every circumstance. But the good news is, lighting can be adjusted. Let’s look at different factors that affect lighting in every scene you shoot. ”
Use CRI, Luminous Efficacy and color temperature controls to match your needs.

Color Temperature
Color temperature describes the “color” of white light by a light source radiated by a perfect black body at a given temperature measured in degrees Kelvinhttps://www.pixelsham.com/2019/10/18/color-temperature/
CRI
“The Color Rendering Index is a measurement of how faithfully a light source reveals the colors of whatever it illuminates, it describes the ability of a light source to reveal the color of an object, as compared to the color a natural light source would provide. The highest possible CRI is 100. A CRI of 100 generally refers to a perfect black body, like a tungsten light source or the sun. ”https://www.studiobinder.com/blog/what-is-color-rendering-index/


https://en.wikipedia.org/wiki/Color_rendering_index
Light source CCT (K) CRI Low-pressure sodium (LPS/SOX) 1800 −44 Clear mercury-vapor 6410 17 High-pressure sodium (HPS/SON) 2100 24 Coated mercury-vapor 3600 49 Halophosphate warm-white fluorescent 2940 51 Halophosphate cool-white fluorescent 4230 64 Tri-phosphor warm-white fluorescent 2940 73 Halophosphate cool-daylight fluorescent 6430 76 “White” SON 2700 82 Standard LED Lamp 2700–5000 83 Quartz metal halide 4200 85 Tri-phosphor cool-white fluorescent 4080 89 High-CRI LED lamp (blue LED) 2700–5000 95 Ceramic discharge metal-halide lamp 5400 96 Ultra-high-CRI LED lamp (violet LED) 2700–5000 99 Incandescent/halogen bulb 3200 100 Luminous Efficacy
Luminous efficacy is a measure of how well a light source produces visible light, watts out versus watts in, measured in lumens per watt. In other words it is a measurement that indicates the ability of a light source to emit visible light using a given amount of power. It is a ratio of the visible energy to the power that goes into the bulb.FILM LIGHT TYPES
Consumer light types
Tungsten Lights
Light interiors and match domestic places or office locations. Daylight.Advantages of Tungsten Lights
Almost perfect color rendition
Low cost
Does not use mercury like CFLs (fluorescent) or mercury vapor lights
Better color temperature than standard tungsten
Longer life than a conventional incandescent
Instant on to full brightness, no warm-up time, and it is dimmableDisadvantages of Tungsten Lights
Extremely hot
High power requirement
The lamp is sensitive to oils and cannot be touched
The bulb is capable of blowing and sending hot glass shards outward. A screen or layer of glass on the outside of the lamp can protect users.Hydrargyrum medium-arc iodide lights
HMI’s are used when high output is required. They are also used to recreate sun shining through windows or to fake additional sun while shooting exteriors. HMIs can light huge areas at once.Advantages of HMI lights
High light output
Higher efficiency
High color temperatureDisadvantages of HMI lights:
High cost
High power requirement
Dims only to about 50%
the color temperature increases with dimming
HMI bulbs will explode is dropped and release toxic chemicalsFluorescent
Fluorescent film lighting is achieved by laying multiple tubes next to each other, combining as many as you want for the desired brightness. The good news is you can choose your bulbs to either be warm or cool depending on the scenario you’re shooting. You want to get these bulbs close to the subject because they’re not great at opening up spaces. Fluorescent lighting is used to light interiors and is more compact and cooler than tungsten or HMI lighting.Advantages of Fluorescent lights
High efficiency
Low power requirement
Low cost
Long lamp life
Cool
Capable of soft even lighting over a large area
LightweightDisadvantages of Fluorescent lights
Flicker
High CRI
Domestic tubes have low CRI & poor color rendition.LED
LED’s are more and more common on film sets. You can use batteries to power them. That makes them portable and sleek – no messy cabled needed. You can rig your own panels of LED lights to fit any space necessary as well. LED’s can also power Fresnel style lamp heads such as the Arri L-series.Advantages of LED light
Soft, even lighting
Pure light without UV-artifacts
High efficiency
Low power consumption, can be battery powered
Excellent dimming by means of pulse width modulation control
Long lifespan
Environmentally friendly
Insensitive to shock
No risk of explosionDisadvantages of LED light
High cost.
LED’s are currently still expensive for their total light output -
THOMAS MANSENCAL – The Apparent Simplicity of RGB Rendering
Read more: THOMAS MANSENCAL – The Apparent Simplicity of RGB Rendering
https://thomasmansencal.substack.com/p/the-apparent-simplicity-of-rgb-rendering
The primary goal of physically-based rendering (PBR) is to create a simulation that accurately reproduces the imaging process of electro-magnetic spectrum radiation incident to an observer. This simulation should be indistinguishable from reality for a similar observer.
Because a camera is not sensitive to incident light the same way than a human observer, the images it captures are transformed to be colorimetric. A project might require infrared imaging simulation, a portion of the electro-magnetic spectrum that is invisible to us. Radically different observers might image the same scene but the act of observing does not change the intrinsic properties of the objects being imaged. Consequently, the physical modelling of the virtual scene should be independent of the observer.
-
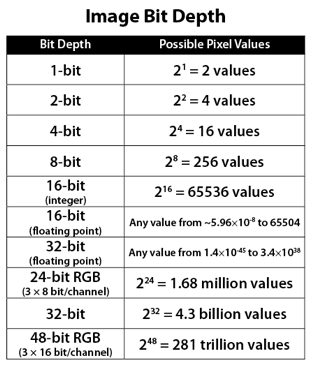
Image rendering bit depth
Read more: Image rendering bit depthThe terms 8-bit, 16-bit, 16-bit float, and 32-bit refer to different data formats used to store and represent image information, as bits per pixel.
https://en.wikipedia.org/wiki/Color_depth
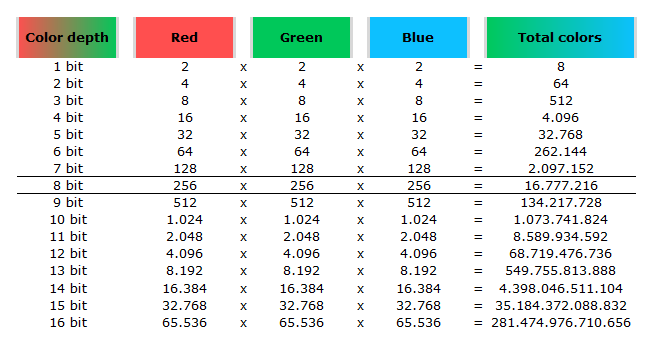
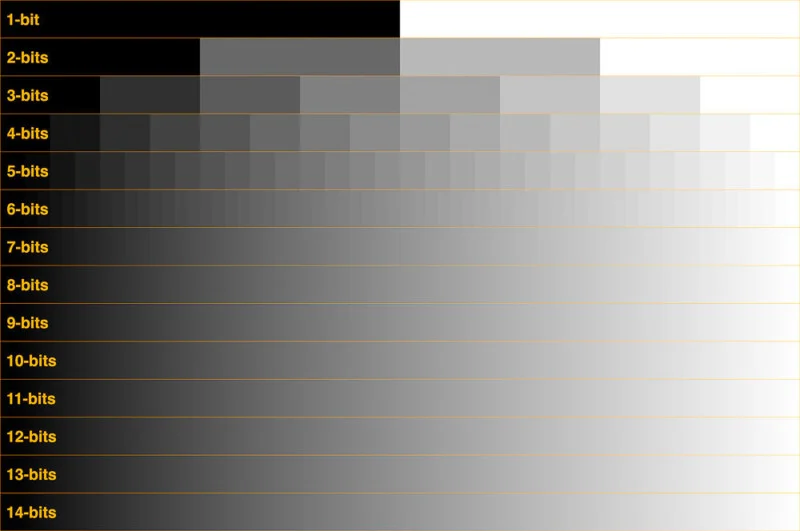
In color technology, color depth also known as bit depth, is either the number of bits used to indicate the color of a single pixel, OR the number of bits used for each color component of a single pixel.
When referring to a pixel, the concept can be defined as bits per pixel (bpp).
When referring to a color component, the concept can be defined as bits per component, bits per channel, bits per color (all three abbreviated bpc), and also bits per pixel component, bits per color channel or bits per sample (bps). Modern standards tend to use bits per component, but historical lower-depth systems used bits per pixel more often.
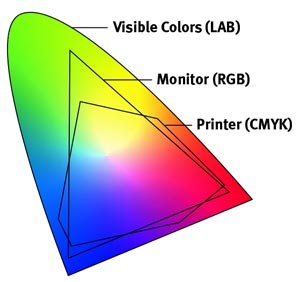
Color depth is only one aspect of color representation, expressing the precision with which the amount of each primary can be expressed; the other aspect is how broad a range of colors can be expressed (the gamut). The definition of both color precision and gamut is accomplished with a color encoding specification which assigns a digital code value to a location in a color space.

Here’s a simple explanation of each.
8-bit images (i.e. 24 bits per pixel for a color image) are considered Low Dynamic Range.
They can store around 5 stops of light and each pixel carry a value from 0 (black) to 255 (white).
As a comparison, DSLR cameras can capture ~12-15 stops of light and they use RAW files to store the information.16-bit: This format is commonly referred to as “half-precision.” It uses 16 bits of data to represent color values for each pixel. With 16 bits, you can have 65,536 discrete levels of color, allowing for relatively high precision and smooth gradients. However, it has a limited dynamic range, meaning it cannot accurately represent extremely bright or dark values. It is commonly used for regular images and textures.
16-bit float: This format is an extension of the 16-bit format but uses floating-point numbers instead of fixed integers. Floating-point numbers allow for more precise calculations and a larger dynamic range. In this case, the 16 bits are used to store both the color value and the exponent, which controls the range of values that can be represented. The 16-bit float format provides better accuracy and a wider dynamic range than regular 16-bit, making it useful for high-dynamic-range imaging (HDRI) and computations that require more precision.
32-bit: (i.e. 96 bits per pixel for a color image) are considered High Dynamic Range. This format, also known as “full-precision” or “float,” uses 32 bits to represent color values and offers the highest precision and dynamic range among the three options. With 32 bits, you have a significantly larger number of discrete levels, allowing for extremely accurate color representation, smooth gradients, and a wide range of brightness values. It is commonly used for professional rendering, visual effects, and scientific applications where maximum precision is required.
Bits and HDR coverage
High Dynamic Range (HDR) images are designed to capture a wide range of luminance values, from the darkest shadows to the brightest highlights, in order to reproduce a scene with more accuracy and detail. The bit depth of an image refers to the number of bits used to represent each pixel’s color information. When comparing 32-bit float and 16-bit float HDR images, the drop in accuracy primarily relates to the precision of the color information.
A 32-bit float HDR image offers a higher level of precision compared to a 16-bit float HDR image. In a 32-bit float format, each color channel (red, green, and blue) is represented by 32 bits, allowing for a larger range of values to be stored. This increased precision enables the image to retain more details and subtleties in color and luminance.
On the other hand, a 16-bit float HDR image utilizes 16 bits per color channel, resulting in a reduced range of values that can be represented. This lower precision leads to a loss of fine details and color nuances, especially in highly contrasted areas of the image where there are significant differences in luminance.
The drop in accuracy between 32-bit and 16-bit float HDR images becomes more noticeable as the exposure range of the scene increases. Exposure range refers to the span between the darkest and brightest areas of an image. In scenes with a limited exposure range, where the luminance differences are relatively small, the loss of accuracy may not be as prominent or perceptible. These images usually are around 8-10 exposure levels.
However, in scenes with a wide exposure range, such as a landscape with deep shadows and bright highlights, the reduced precision of a 16-bit float HDR image can result in visible artifacts like color banding, posterization, and loss of detail in both shadows and highlights. The image may exhibit abrupt transitions between tones or colors, which can appear unnatural and less realistic.
To provide a rough estimate, it is often observed that exposure values beyond approximately ±6 to ±8 stops from the middle gray (18% reflectance) may be more prone to accuracy issues in a 16-bit float format. This range may vary depending on the specific implementation and encoding scheme used.
To summarize, the drop in accuracy between 32-bit and 16-bit float HDR images is mainly related to the reduced precision of color information. This decrease in precision becomes more apparent in scenes with a wide exposure range, affecting the representation of fine details and leading to visible artifacts in the image.
In practice, this means that exposure values beyond a certain range will experience a loss of accuracy and detail when stored in a 16-bit float format. The exact range at which this loss occurs depends on the encoding scheme and the specific implementation. However, in general, extremely bright or extremely dark values that fall outside the representable range may be subject to quantization errors, resulting in loss of detail, banding, or other artifacts.
HDRs used for lighting purposes are usually slightly convolved to improve on sampling speed and removing specular artefacts. To that extent, 16 bit float HDRIs tend to me most used in CG cycles.
-
Gamma correction
Read more: Gamma correction

http://www.normankoren.com/makingfineprints1A.html#Gammabox
https://en.wikipedia.org/wiki/Gamma_correction
http://www.photoscientia.co.uk/Gamma.htm
https://www.w3.org/Graphics/Color/sRGB.html
http://www.eizoglobal.com/library/basics/lcd_display_gamma/index.html
https://forum.reallusion.com/PrintTopic308094.aspx
Basically, gamma is the relationship between the brightness of a pixel as it appears on the screen, and the numerical value of that pixel. Generally Gamma is just about defining relationships.
Three main types:
– Image Gamma encoded in images
– Display Gammas encoded in hardware and/or viewing time
– System or Viewing Gamma which is the net effect of all gammas when you look back at a final image. In theory this should flatten back to 1.0 gamma.Our eyes, different camera or video recorder devices do not correctly capture luminance. (they are not linear)
Different display devices (monitor, phone screen, TV) do not display luminance correctly neither. So, one needs to correct them, therefore the gamma correction function.The human perception of brightness, under common illumination conditions (not pitch black nor blindingly bright), follows an approximate power function (note: no relation to the gamma function), with greater sensitivity to relative differences between darker tones than between lighter ones, consistent with the Stevens’ power law for brightness perception. If images are not gamma-encoded, they allocate too many bits or too much bandwidth to highlights that humans cannot differentiate, and too few bits or too little bandwidth to shadow values that humans are sensitive to and would require more bits/bandwidth to maintain the same visual quality.
https://blog.amerlux.com/4-things-architects-should-know-about-lumens-vs-perceived-brightness/
cones manage color receptivity, rods determine how large our pupils should be. The larger (more dilated) our pupils are, the more light enters our eyes. In dark situations, our rods dilate our pupils so we can see better. This impacts how we perceive brightness.


https://www.cambridgeincolour.com/tutorials/gamma-correction.htm
A gamma encoded image has to have “gamma correction” applied when it is viewed — which effectively converts it back into light from the original scene. In other words, the purpose of gamma encoding is for recording the image — not for displaying the image. Fortunately this second step (the “display gamma”) is automatically performed by your monitor and video card. The following diagram illustrates how all of this fits together:

Display gamma
The display gamma can be a little confusing because this term is often used interchangeably with gamma correction, since it corrects for the file gamma. This is the gamma that you are controlling when you perform monitor calibration and adjust your contrast setting. Fortunately, the industry has converged on a standard display gamma of 2.2, so one doesn’t need to worry about the pros/cons of different values.Gamma encoding of images is used to optimize the usage of bits when encoding an image, or bandwidth used to transport an image, by taking advantage of the non-linear manner in which humans perceive light and color. Human response to luminance is also biased. Especially sensible to dark areas.
Thus, the human visual system has a non-linear response to the power of the incoming light, so a fixed increase in power will not have a fixed increase in perceived brightness.
We perceive a value as half bright when it is actually 18% of the original intensity not 50%. As such, our perception is not linear.You probably already know that a pixel can have any ‘value’ of Red, Green, and Blue between 0 and 255, and you would therefore think that a pixel value of 127 would appear as half of the maximum possible brightness, and that a value of 64 would represent one-quarter brightness, and so on. Well, that’s just not the case.

Pixar Color Management
https://renderman.pixar.com/color-management
– Why do we need linear gamma?
Because light works linearly and therefore only works properly when it lights linear values.– Why do we need to view in sRGB?
Because the resulting linear image in not suitable for viewing, but contains all the proper data. Pixar’s IT viewer can compensate by showing the rendered image through a sRGB look up table (LUT), which is identical to what will be the final image after the sRGB gamma curve is applied in post.This would be simple enough if every software would play by the same rules, but they don’t. In fact, the default gamma workflow for many 3D software is incorrect. This is where the knowledge of a proper imaging workflow comes in to save the day.
Cathode-ray tubes have a peculiar relationship between the voltage applied to them, and the amount of light emitted. It isn’t linear, and in fact it follows what’s called by mathematicians and other geeks, a ‘power law’ (a number raised to a power). The numerical value of that power is what we call the gamma of the monitor or system.
Thus. Gamma describes the nonlinear relationship between the pixel levels in your computer and the luminance of your monitor (the light energy it emits) or the reflectance of your prints. The equation is,
Luminance = C * value^gamma + black level
– C is set by the monitor Contrast control.
– Value is the pixel level normalized to a maximum of 1. For an 8 bit monitor with pixel levels 0 – 255, value = (pixel level)/255.
– Black level is set by the (misnamed) monitor Brightness control. The relationship is linear if gamma = 1. The chart illustrates the relationship for gamma = 1, 1.5, 1.8 and 2.2 with C = 1 and black level = 0.
Gamma affects middle tones; it has no effect on black or white. If gamma is set too high, middle tones appear too dark. Conversely, if it’s set too low, middle tones appear too light.
The native gamma of monitors– the relationship between grid voltage and luminance– is typically around 2.5, though it can vary considerably. This is well above any of the display standards, so you must be aware of gamma and correct it.
A display gamma of 2.2 is the de facto standard for the Windows operating system and the Internet-standard sRGB color space.
The old standard for Mcintosh and prepress file interchange is 1.8. It is now 2.2 as well.
Video cameras have gammas of approximately 0.45– the inverse of 2.2. The viewing or system gamma is the product of the gammas of all the devices in the system– the image acquisition device (film+scanner or digital camera), color lookup table (LUT), and monitor. System gamma is typically between 1.1 and 1.5. Viewing flare and other factor make images look flat at system gamma = 1.0.
Most laptop LCD screens are poorly suited for critical image editing because gamma is extremely sensitive to viewing angle.
More about screens
https://www.cambridgeincolour.com/tutorials/gamma-correction.htm
CRT Monitors. Due to an odd bit of engineering luck, the native gamma of a CRT is 2.5 — almost the inverse of our eyes. Values from a gamma-encoded file could therefore be sent straight to the screen and they would automatically be corrected and appear nearly OK. However, a small gamma correction of ~1/1.1 needs to be applied to achieve an overall display gamma of 2.2. This is usually already set by the manufacturer’s default settings, but can also be set during monitor calibration.
LCD Monitors. LCD monitors weren’t so fortunate; ensuring an overall display gamma of 2.2 often requires substantial corrections, and they are also much less consistent than CRT’s. LCDs therefore require something called a look-up table (LUT) in order to ensure that input values are depicted using the intended display gamma (amongst other things). See the tutorial on monitor calibration: look-up tables for more on this topic.
About black level (brightness). Your monitor’s brightness control (which should actually be called black level) can be adjusted using the mostly black pattern on the right side of the chart. This pattern contains two dark gray vertical bars, A and B, which increase in luminance with increasing gamma. (If you can’t see them, your black level is way low.) The left bar (A) should be just above the threshold of visibility opposite your chosen gamma (2.2 or 1.8)– it should be invisible where gamma is lower by about 0.3. The right bar (B) should be distinctly visible: brighter than (A), but still very dark. This chart is only for monitors; it doesn’t work on printed media.
The 1.8 and 2.2 gray patterns at the bottom of the image represent a test of monitor quality and calibration. If your monitor is functioning properly and calibrated to gamma = 2.2 or 1.8, the corresponding pattern will appear smooth neutral gray when viewed from a distance. Any waviness, irregularity, or color banding indicates incorrect monitor calibration or poor performance.
Another test to see whether one’s computer monitor is properly hardware adjusted and can display shadow detail in sRGB images properly, they should see the left half of the circle in the large black square very faintly but the right half should be clearly visible. If not, one can adjust their monitor’s contrast and/or brightness setting. This alters the monitor’s perceived gamma. The image is best viewed against a black background.
This procedure is not suitable for calibrating or print-proofing a monitor. It can be useful for making a monitor display sRGB images approximately correctly, on systems in which profiles are not used (for example, the Firefox browser prior to version 3.0 and many others) or in systems that assume untagged source images are in the sRGB colorspace.
On some operating systems running the X Window System, one can set the gamma correction factor (applied to the existing gamma value) by issuing the command xgamma -gamma 0.9 for setting gamma correction factor to 0.9, and xgamma for querying current value of that factor (the default is 1.0). In OS X systems, the gamma and other related screen calibrations are made through the System Preference

https://www.kinematicsoup.com/news/2016/6/15/gamma-and-linear-space-what-they-are-how-they-differ
Linear color space means that numerical intensity values correspond proportionally to their perceived intensity. This means that the colors can be added and multiplied correctly. A color space without that property is called ”non-linear”. Below is an example where an intensity value is doubled in a linear and a non-linear color space. While the corresponding numerical values in linear space are correct, in the non-linear space (gamma = 0.45, more on this later) we can’t simply double the value to get the correct intensity.

The need for gamma arises for two main reasons: The first is that screens have been built with a non-linear response to intensity. The other is that the human eye can tell the difference between darker shades better than lighter shades. This means that when images are compressed to save space, we want to have greater accuracy for dark intensities at the expense of lighter intensities. Both of these problems are resolved using gamma correction, which is to say the intensity of every pixel in an image is put through a power function. Specifically, gamma is the name given to the power applied to the image.
CRT screens, simply by how they work, apply a gamma of around 2.2, and modern LCD screens are designed to mimic that behavior. A gamma of 2.2, the reciprocal of 0.45, when applied to the brightened images will darken them, leaving the original image.


LIGHTING
-
Photography basics: How Exposure Stops (Aperture, Shutter Speed, and ISO) Affect Your Photos – cheat sheet cards
Read more: Photography basics: How Exposure Stops (Aperture, Shutter Speed, and ISO) Affect Your Photos – cheat sheet cardsAlso see:
https://www.pixelsham.com/2018/11/22/exposure-value-measurements/
https://www.pixelsham.com/2016/03/03/f-stop-vs-t-stop/

An exposure stop is a unit measurement of Exposure as such it provides a universal linear scale to measure the increase and decrease in light, exposed to the image sensor, due to changes in shutter speed, iso and f-stop.
+-1 stop is a doubling or halving of the amount of light let in when taking a photo
1 EV (exposure value) is just another way to say one stop of exposure change.
https://www.photographymad.com/pages/view/what-is-a-stop-of-exposure-in-photography
Same applies to shutter speed, iso and aperture.
Doubling or halving your shutter speed produces an increase or decrease of 1 stop of exposure.
Doubling or halving your iso speed produces an increase or decrease of 1 stop of exposure.


Because of the way f-stop numbers are calculated (ratio of focal length/lens diameter, where focal length is the distance between the lens and the sensor), an f-stop doesn’t relate to a doubling or halving of the value, but to the doubling/halving of the area coverage of a lens in relation to its focal length. And as such, to a multiplying or dividing by 1.41 (the square root of 2). For example, going from f/2.8 to f/4 is a decrease of 1 stop because 4 = 2.8 * 1.41. Changing from f/16 to f/11 is an increase of 1 stop because 11 = 16 / 1.41.


A wider aperture means that light proceeding from the foreground, subject, and background is entering at more oblique angles than the light entering less obliquely.
Consider that absolutely everything is bathed in light, therefore light bouncing off of anything is effectively omnidirectional. Your camera happens to be picking up a tiny portion of the light that’s bouncing off into infinity.
Now consider that the wider your iris/aperture, the more of that omnidirectional light you’re picking up:

When you have a very narrow iris you are eliminating a lot of oblique light. Whatever light enters, from whatever distance, enters moderately parallel as a whole. When you have a wide aperture, much more light is entering at a multitude of angles. Your lens can only focus the light from one depth – the foreground/background appear blurred because it cannot be focused on.
https://frankwhitephotography.com/index.php?id=28:what-is-a-stop-in-photography

The great thing about stops is that they give us a way to directly compare shutter speed, aperture diameter, and ISO speed. This means that we can easily swap these three components about while keeping the overall exposure the same.
http://lifehacker.com/how-aperture-shutter-speed-and-iso-affect-pictures-sh-1699204484

https://www.techradar.com/how-to/the-exposure-triangle

https://www.videoschoolonline.com/what-is-an-exposure-stop
Note. All three of these measurements (aperture, shutter, iso) have full stops, half stops and third stops, but if you look at the numbers they aren’t always consistent. For example, a one third stop between ISO100 and ISO 200 would be ISO133, yet most cameras are marked at ISO125.

Third-stops are especially important as they’re the increment that most cameras use for their settings. These are just imaginary divisions in each stop.
From a practical standpoint manufacturers only standardize the full stops, meaning that while they try and stay somewhat consistent there is some rounding up going on between the smaller numbers.


Note that ND Filters directly modify the exposure triangle.


-
HDRI Median Cut plugin
Read more: HDRI Median Cut pluginwww.hdrlabs.com/picturenaut/plugins.html

Note. The Median Cut algorithm is typically used for color quantization, which involves reducing the number of colors in an image while preserving its visual quality. It doesn’t directly provide a way to identify the brightest areas in an image. However, if you’re interested in identifying the brightest areas, you might want to look into other methods like thresholding, histogram analysis, or edge detection, through openCV for example.
Here is an openCV example:
# bottom left coordinates = 0,0 import numpy as np import cv2 # Load the HDR or EXR image image = cv2.imread('your_image_path.exr', cv2.IMREAD_UNCHANGED) # Load as-is without modification # Calculate the luminance from the HDR channels (assuming RGB format) luminance = np.dot(image[..., :3], [0.299, 0.587, 0.114]) # Set a threshold value based on estimated EV threshold_value = 2.4 # Estimated threshold value based on 4.8 EV # Apply the threshold to identify bright areas # Theluminancearray contains the calculated luminance values for each pixel in the image. # Thethreshold_valueis a user-defined value that represents a cutoff point, separating "bright" and "dark" areas in terms of perceived luminance.thresholded = (luminance > threshold_value) * 255 # Convert the thresholded image to uint8 for contour detection thresholded = thresholded.astype(np.uint8) # Find contours of the bright areas contours, _ = cv2.findContours(thresholded, cv2.RETR_EXTERNAL, cv2.CHAIN_APPROX_SIMPLE) # Create a list to store the bounding boxes of bright areas bright_areas = [] # Iterate through contours and extract bounding boxes for contour in contours: x, y, w, h = cv2.boundingRect(contour) # Adjust y-coordinate based on bottom-left origin y_bottom_left_origin = image.shape[0] - (y + h) bright_areas.append((x, y_bottom_left_origin, x + w, y_bottom_left_origin + h)) # Store as (x1, y1, x2, y2) # Print the identified bright areas print("Bright Areas (x1, y1, x2, y2):") for area in bright_areas: print(area)More details
Luminance and Exposure in an EXR Image:
- An EXR (Extended Dynamic Range) image format is often used to store high dynamic range (HDR) images that contain a wide range of luminance values, capturing both dark and bright areas.
- Luminance refers to the perceived brightness of a pixel in an image. In an RGB image, luminance is often calculated using a weighted sum of the red, green, and blue channels, where different weights are assigned to each channel to account for human perception.
- In an EXR image, the pixel values can represent radiometrically accurate scene values, including actual radiance or irradiance levels. These values are directly related to the amount of light emitted or reflected by objects in the scene.
The luminance line is calculating the luminance of each pixel in the image using a weighted sum of the red, green, and blue channels. The three float values [0.299, 0.587, 0.114] are the weights used to perform this calculation.
These weights are based on the concept of luminosity, which aims to approximate the perceived brightness of a color by taking into account the human eye’s sensitivity to different colors. The values are often derived from the NTSC (National Television System Committee) standard, which is used in various color image processing operations.
Here’s the breakdown of the float values:
- 0.299: Weight for the red channel.
- 0.587: Weight for the green channel.
- 0.114: Weight for the blue channel.
The weighted sum of these channels helps create a grayscale image where the pixel values represent the perceived brightness. This technique is often used when converting a color image to grayscale or when calculating luminance for certain operations, as it takes into account the human eye’s sensitivity to different colors.
For the threshold, remember that the exact relationship between EV values and pixel values can depend on the tone-mapping or normalization applied to the HDR image, as well as the dynamic range of the image itself.
To establish a relationship between exposure and the threshold value, you can consider the relationship between linear and logarithmic scales:
- Linear and Logarithmic Scales:
- Exposure values in an EXR image are often represented in logarithmic scales, such as EV (exposure value). Each increment in EV represents a doubling or halving of the amount of light captured.
- Threshold values for luminance thresholding are usually linear, representing an actual luminance level.
- Conversion Between Scales:
- To establish a mathematical relationship, you need to convert between the logarithmic exposure scale and the linear threshold scale.
- One common method is to use a power function. For instance, you can use a power function to convert EV to a linear intensity value.
threshold_value = base_value * (2 ** EV)Here,
EVis the exposure value,base_valueis a scaling factor that determines the relationship between EV and threshold_value, and2 ** EVis used to convert the logarithmic EV to a linear intensity value. - Choosing the Base Value:
- The
base_valuefactor should be determined based on the dynamic range of your EXR image and the specific luminance values you are dealing with. - You may need to experiment with different values of
base_valueto achieve the desired separation of bright areas from the rest of the image.
- The
Let’s say you have an EXR image with a dynamic range of 12 EV, which is a common range for many high dynamic range images. In this case, you want to set a threshold value that corresponds to a certain number of EV above the middle gray level (which is often considered to be around 0.18).
Here’s an example of how you might determine a
base_valueto achieve this:# Define the dynamic range of the image in EV dynamic_range = 12 # Choose the desired number of EV above middle gray for thresholding desired_ev_above_middle_gray = 2 # Calculate the threshold value based on the desired EV above middle gray threshold_value = 0.18 * (2 ** (desired_ev_above_middle_gray / dynamic_range)) print("Threshold Value:", threshold_value) -
Outpost VFX lighting tips
Read more: Outpost VFX lighting tipswww.outpost-vfx.com/en/news/18-pro-tips-and-tricks-for-lighting
Get as much information regarding your plate lighting as possible
- Always use a reference
- Replicate what is happening in real life
- Invest into a solid HDRI
- Start Simple
- Observe real world lighting, photography and cinematography
- Don’t neglect the theory
- Learn the difference between realism and photo-realism.
- Keep your scenes organised

-
Willem Zwarthoed – Aces gamut in VFX production pdf
Read more: Willem Zwarthoed – Aces gamut in VFX production pdfhttps://www.provideocoalition.com/color-management-part-12-introducing-aces/
Local copy:
https://www.slideshare.net/hpduiker/acescg-a-common-color-encoding-for-visual-effects-applications
-
domeble – Hi-Resolution CGI Backplates and 360° HDRI
Read more: domeble – Hi-Resolution CGI Backplates and 360° HDRIWhen collecting hdri make sure the data supports basic metadata, such as:
- Iso
- Aperture
- Exposure time or shutter time
- Color temperature
- Color space Exposure value (what the sensor receives of the sun intensity in lux)
- 7+ brackets (with 5 or 6 being the perceived balanced exposure)
In image processing, computer graphics, and photography, high dynamic range imaging (HDRI or just HDR) is a set of techniques that allow a greater dynamic range of luminances (a Photometry measure of the luminous intensity per unit area of light travelling in a given direction. It describes the amount of light that passes through or is emitted from a particular area, and falls within a given solid angle) between the lightest and darkest areas of an image than standard digital imaging techniques or photographic methods. This wider dynamic range allows HDR images to represent more accurately the wide range of intensity levels found in real scenes ranging from direct sunlight to faint starlight and to the deepest shadows.
The two main sources of HDR imagery are computer renderings and merging of multiple photographs, which in turn are known as low dynamic range (LDR) or standard dynamic range (SDR) images. Tone Mapping (Look-up) techniques, which reduce overall contrast to facilitate display of HDR images on devices with lower dynamic range, can be applied to produce images with preserved or exaggerated local contrast for artistic effect. Photography
In photography, dynamic range is measured in Exposure Values (in photography, exposure value denotes all combinations of camera shutter speed and relative aperture that give the same exposure. The concept was developed in Germany in the 1950s) differences or stops, between the brightest and darkest parts of the image that show detail. An increase of one EV or one stop is a doubling of the amount of light.
The human response to brightness is well approximated by a Steven’s power law, which over a reasonable range is close to logarithmic, as described by the Weber�Fechner law, which is one reason that logarithmic measures of light intensity are often used as well.
HDR is short for High Dynamic Range. It’s a term used to describe an image which contains a greater exposure range than the “black” to “white” that 8 or 16-bit integer formats (JPEG, TIFF, PNG) can describe. Whereas these Low Dynamic Range images (LDR) can hold perhaps 8 to 10 f-stops of image information, HDR images can describe beyond 30 stops and stored in 32 bit images.


COLLECTIONS
| Featured AI
| Design And Composition
| Explore posts
POPULAR SEARCHES
unreal | pipeline | virtual production | free | learn | photoshop | 360 | macro | google | nvidia | resolution | open source | hdri | real-time | photography basics | nuke
FEATURED POSTS
-
Black Body color aka the Planckian Locus curve for white point eye perception
-
How to paint a boardgame miniatures
-
How does Stable Diffusion work?
-
AnimationXpress.com interviews Daniele Tosti for TheCgCareer.com channel
-
Principles of Animation with Alan Becker, Dermot OConnor and Shaun Keenan
-
Convert 2D Images to 3D Models
-
HDRI Median Cut plugin
-
Photography basics: Lumens vs Candelas (candle) vs Lux vs FootCandle vs Watts vs Irradiance vs Illuminance
Social Links
DISCLAIMER – Links and images on this website may be protected by the respective owners’ copyright. All data submitted by users through this site shall be treated as freely available to share.
