


COMPOSITION
-
StudioBinder – Roger Deakins on How to Choose a Camera Lens — Cinematography Composition Techniques
Read more: StudioBinder – Roger Deakins on How to Choose a Camera Lens — Cinematography Composition Techniques
https://www.studiobinder.com/blog/camera-lens-buying-guide/
https://www.studiobinder.com/blog/e-books/camera-lenses-explained-volume-1-ebook


DESIGN
-
Cosmic Motors book by Daniel Simon
Read more: Cosmic Motors book by Daniel Simonhttp://danielsimon.com/cosmic-motors-the-book/

Book Cover Cosmic Motors, Copyright by Cosmic Motors LLC / Daniel Simon www.danielsimon.com -
boldtron – 𝗗𝗘𝗣𝗜𝗖𝗧𝗜𝗡𝗚 𝗪𝗔𝗧𝗘𝗥𝗚𝗨𝗡𝗦
Read more: boldtron – 𝗗𝗘𝗣𝗜𝗖𝗧𝗜𝗡𝗚 𝗪𝗔𝗧𝗘𝗥𝗚𝗨𝗡𝗦See this Instagram post by @boldtron using ComfyUI + Krea
https://www.instagram.com/p/C5v-H0PNYYg/?utm_source=ig_web_button_share_sheet
-
Arminas Valunas – “Coca-Cola: Wherever you are.”
Read more: Arminas Valunas – “Coca-Cola: Wherever you are.”Arminas created this using Juggernaut Xl model and QR Code Monster SDXL ControlNet.
His pipeline:
Static Images – Forge UI.
Upscaled with Leonardo AI universal upscaler.
Animated with Runway ML and Minimax.
Video upscale – Topaz Video AI.
Composited in Adobe Premiere.
Juggernaut Xl download here:
https://civitai.com/models/133005/juggernaut-xl
QR Code Monster SDXL:
https://civitai.com/models/197247?modelVersionId=221829


COLOR
-
GretagMacbeth Color Checker Numeric Values and Middle Gray
Read more: GretagMacbeth Color Checker Numeric Values and Middle GrayThe human eye perceives half scene brightness not as the linear 50% of the present energy (linear nature values) but as 18% of the overall brightness. We are biased to perceive more information in the dark and contrast areas. A Macbeth chart helps with calibrating back into a photographic capture into this “human perspective” of the world.
https://en.wikipedia.org/wiki/Middle_gray
In photography, painting, and other visual arts, middle gray or middle grey is a tone that is perceptually about halfway between black and white on a lightness scale in photography and printing, it is typically defined as 18% reflectance in visible light
Light meters, cameras, and pictures are often calibrated using an 18% gray card[4][5][6] or a color reference card such as a ColorChecker. On the assumption that 18% is similar to the average reflectance of a scene, a grey card can be used to estimate the required exposure of the film.
https://en.wikipedia.org/wiki/ColorChecker

The exposure meter in the camera does not know whether the subject itself is bright or not. It simply measures the amount of light that comes in, and makes a guess based on that. The camera will aim for 18% gray independently, meaning if you take a photo of an entirely white surface, and an entirely black surface you should get two identical images which both are gray (at least in theory). Thus enters the Macbeth chart.

<!–more–>
Note that Chroma Key Green is reasonably close to an 18% gray reflectance.
http://www.rags-int-inc.com/PhotoTechStuff/MacbethTarget/

No Camera Data 
https://upload.wikimedia.org/wikipedia/commons/b/b4/CIE1931xy_ColorChecker_SMIL.svg

RGB coordinates of the Macbeth ColorChecker
https://pdfs.semanticscholar.org/0e03/251ad1e6d3c3fb9cb0b1f9754351a959e065.pdf


-
About green screens
Read more: About green screenshackaday.com/2015/02/07/how-green-screen-worked-before-computers/
www.newtek.com/blog/tips/best-green-screen-materials/
www.chromawall.com/blog//chroma-key-green

Chroma Key Green, the color of green screens is also known as Chroma Green and is valued at approximately 354C in the Pantone color matching system (PMS).
Chroma Green can be broken down in many different ways. Here is green screen green as other values useful for both physical and digital production:
Green Screen as RGB Color Value: 0, 177, 64
Green Screen as CMYK Color Value: 81, 0, 92, 0
Green Screen as Hex Color Value: #00b140
Green Screen as Websafe Color Value: #009933Chroma Key Green is reasonably close to an 18% gray reflectance.
Illuminate your green screen with an uniform source with less than 2/3 EV variation.
The level of brightness at any given f-stop should be equivalent to a 90% white card under the same lighting. -
StudioBinder.com – CRI color rendering index
Read more: StudioBinder.com – CRI color rendering indexwww.studiobinder.com/blog/what-is-color-rendering-index
“The Color Rendering Index is a measurement of how faithfully a light source reveals the colors of whatever it illuminates, it describes the ability of a light source to reveal the color of an object, as compared to the color a natural light source would provide. The highest possible CRI is 100. A CRI of 100 generally refers to a perfect black body, like a tungsten light source or the sun. ”


www.pixelsham.com/2021/04/28/types-of-film-lights-and-their-efficiency
-
Victor Perez – The Color Management Handbook for Visual Effects Artists
Read more: Victor Perez – The Color Management Handbook for Visual Effects ArtistsDigital Color Principles, Color Management Fundamentals & ACES Workflows

-
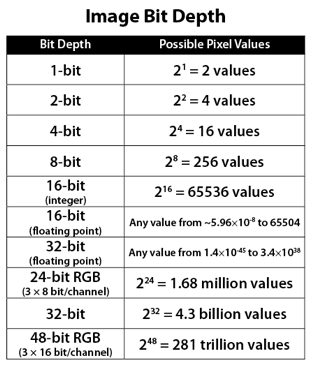
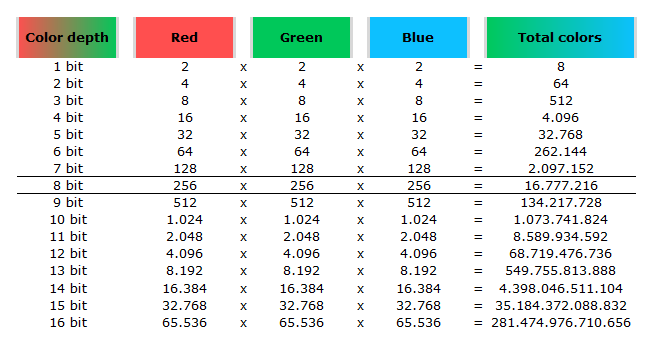
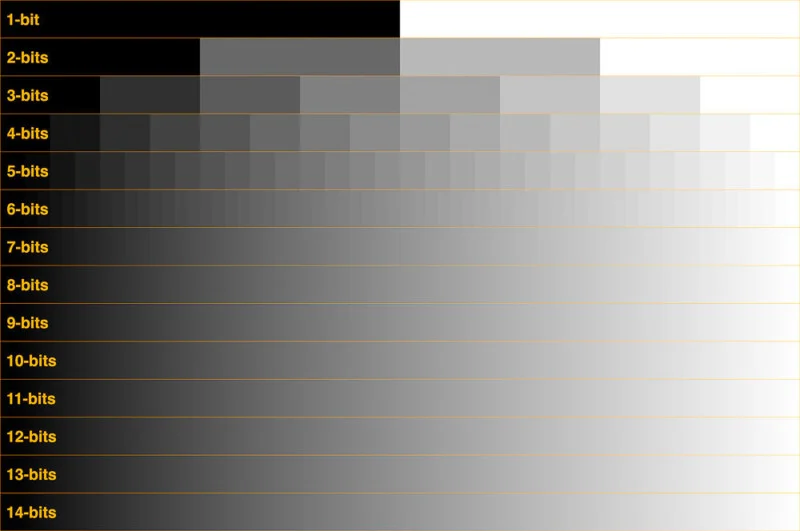
Image rendering bit depth
Read more: Image rendering bit depthThe terms 8-bit, 16-bit, 16-bit float, and 32-bit refer to different data formats used to store and represent image information, as bits per pixel.
https://en.wikipedia.org/wiki/Color_depth
In color technology, color depth also known as bit depth, is either the number of bits used to indicate the color of a single pixel, OR the number of bits used for each color component of a single pixel.
When referring to a pixel, the concept can be defined as bits per pixel (bpp).
When referring to a color component, the concept can be defined as bits per component, bits per channel, bits per color (all three abbreviated bpc), and also bits per pixel component, bits per color channel or bits per sample (bps). Modern standards tend to use bits per component, but historical lower-depth systems used bits per pixel more often.
Color depth is only one aspect of color representation, expressing the precision with which the amount of each primary can be expressed; the other aspect is how broad a range of colors can be expressed (the gamut). The definition of both color precision and gamut is accomplished with a color encoding specification which assigns a digital code value to a location in a color space.

Here’s a simple explanation of each.
8-bit images (i.e. 24 bits per pixel for a color image) are considered Low Dynamic Range.
They can store around 5 stops of light and each pixel carry a value from 0 (black) to 255 (white).
As a comparison, DSLR cameras can capture ~12-15 stops of light and they use RAW files to store the information.16-bit: This format is commonly referred to as “half-precision.” It uses 16 bits of data to represent color values for each pixel. With 16 bits, you can have 65,536 discrete levels of color, allowing for relatively high precision and smooth gradients. However, it has a limited dynamic range, meaning it cannot accurately represent extremely bright or dark values. It is commonly used for regular images and textures.
16-bit float: This format is an extension of the 16-bit format but uses floating-point numbers instead of fixed integers. Floating-point numbers allow for more precise calculations and a larger dynamic range. In this case, the 16 bits are used to store both the color value and the exponent, which controls the range of values that can be represented. The 16-bit float format provides better accuracy and a wider dynamic range than regular 16-bit, making it useful for high-dynamic-range imaging (HDRI) and computations that require more precision.
32-bit: (i.e. 96 bits per pixel for a color image) are considered High Dynamic Range. This format, also known as “full-precision” or “float,” uses 32 bits to represent color values and offers the highest precision and dynamic range among the three options. With 32 bits, you have a significantly larger number of discrete levels, allowing for extremely accurate color representation, smooth gradients, and a wide range of brightness values. It is commonly used for professional rendering, visual effects, and scientific applications where maximum precision is required.
Bits and HDR coverage
High Dynamic Range (HDR) images are designed to capture a wide range of luminance values, from the darkest shadows to the brightest highlights, in order to reproduce a scene with more accuracy and detail. The bit depth of an image refers to the number of bits used to represent each pixel’s color information. When comparing 32-bit float and 16-bit float HDR images, the drop in accuracy primarily relates to the precision of the color information.
A 32-bit float HDR image offers a higher level of precision compared to a 16-bit float HDR image. In a 32-bit float format, each color channel (red, green, and blue) is represented by 32 bits, allowing for a larger range of values to be stored. This increased precision enables the image to retain more details and subtleties in color and luminance.
On the other hand, a 16-bit float HDR image utilizes 16 bits per color channel, resulting in a reduced range of values that can be represented. This lower precision leads to a loss of fine details and color nuances, especially in highly contrasted areas of the image where there are significant differences in luminance.
The drop in accuracy between 32-bit and 16-bit float HDR images becomes more noticeable as the exposure range of the scene increases. Exposure range refers to the span between the darkest and brightest areas of an image. In scenes with a limited exposure range, where the luminance differences are relatively small, the loss of accuracy may not be as prominent or perceptible. These images usually are around 8-10 exposure levels.
However, in scenes with a wide exposure range, such as a landscape with deep shadows and bright highlights, the reduced precision of a 16-bit float HDR image can result in visible artifacts like color banding, posterization, and loss of detail in both shadows and highlights. The image may exhibit abrupt transitions between tones or colors, which can appear unnatural and less realistic.
To provide a rough estimate, it is often observed that exposure values beyond approximately ±6 to ±8 stops from the middle gray (18% reflectance) may be more prone to accuracy issues in a 16-bit float format. This range may vary depending on the specific implementation and encoding scheme used.
To summarize, the drop in accuracy between 32-bit and 16-bit float HDR images is mainly related to the reduced precision of color information. This decrease in precision becomes more apparent in scenes with a wide exposure range, affecting the representation of fine details and leading to visible artifacts in the image.
In practice, this means that exposure values beyond a certain range will experience a loss of accuracy and detail when stored in a 16-bit float format. The exact range at which this loss occurs depends on the encoding scheme and the specific implementation. However, in general, extremely bright or extremely dark values that fall outside the representable range may be subject to quantization errors, resulting in loss of detail, banding, or other artifacts.
HDRs used for lighting purposes are usually slightly convolved to improve on sampling speed and removing specular artefacts. To that extent, 16 bit float HDRIs tend to me most used in CG cycles.
-
Photography basics: Color Temperature and White Balance
Read more: Photography basics: Color Temperature and White Balance

Color Temperature of a light source describes the spectrum of light which is radiated from a theoretical “blackbody” (an ideal physical body that absorbs all radiation and incident light – neither reflecting it nor allowing it to pass through) with a given surface temperature.
https://en.wikipedia.org/wiki/Color_temperature
Or. Most simply it is a method of describing the color characteristics of light through a numerical value that corresponds to the color emitted by a light source, measured in degrees of Kelvin (K) on a scale from 1,000 to 10,000.
More accurately. The color temperature of a light source is the temperature of an ideal backbody that radiates light of comparable hue to that of the light source.
As such, the color temperature of a light source is a numerical measurement of its color appearance. It is based on the principle that any object will emit light if it is heated to a high enough temperature, and that the color of that light will shift in a predictable manner as the temperature is increased. The system is based on the color changes of a theoretical “blackbody radiator” as it is heated from a cold black to a white hot state.
So, why do we measure the hue of the light as a “temperature”? This was started in the late 1800s, when the British physicist William Kelvin heated a block of carbon. It glowed in the heat, producing a range of different colors at different temperatures. The black cube first produced a dim red light, increasing to a brighter yellow as the temperature went up, and eventually produced a bright blue-white glow at the highest temperatures. In his honor, Color Temperatures are measured in degrees Kelvin, which are a variation on Centigrade degrees. Instead of starting at the temperature water freezes, the Kelvin scale starts at “absolute zero,” which is -273 Centigrade.
More about black bodies here: https://www.pixelsham.com/2013/03/14/black-body-color

Details in the post
-
Akiyoshi Kitaoka – Surround biased illumination perception
Read more: Akiyoshi Kitaoka – Surround biased illumination perceptionhttps://x.com/AkiyoshiKitaoka/status/1798705648001327209
The left face appears whitish and the right one blackish, but they are made up of the same luminance.

https://community.wolfram.com/groups/-/m/t/3191015
Illusory staircase Gelb effect
https://www.psy.ritsumei.ac.jp/akitaoka/illgelbe.html


LIGHTING
-
Capturing the world in HDR for real time projects – Call of Duty: Advanced Warfare
Read more: Capturing the world in HDR for real time projects – Call of Duty: Advanced WarfareReal-World Measurements for Call of Duty: Advanced Warfare
www.activision.com/cdn/research/Real_World_Measurements_for_Call_of_Duty_Advanced_Warfare.pdf
Local version
Real_World_Measurements_for_Call_of_Duty_Advanced_Warfare.pdf

-
Photography basics: Why Use a (MacBeth) Color Chart?
Read more: Photography basics: Why Use a (MacBeth) Color Chart?Start here: https://www.pixelsham.com/2013/05/09/gretagmacbeth-color-checker-numeric-values/
https://www.studiobinder.com/blog/what-is-a-color-checker-tool/


In LightRoom

in Final Cut

in Nuke
Note: In Foundry’s Nuke, the software will map 18% gray to whatever your center f/stop is set to in the viewer settings (f/8 by default… change that to EV by following the instructions below).
You can experiment with this by attaching an Exposure node to a Constant set to 0.18, setting your viewer read-out to Spotmeter, and adjusting the stops in the node up and down. You will see that a full stop up or down will give you the respective next value on the aperture scale (f8, f11, f16 etc.).One stop doubles or halves the amount or light that hits the filmback/ccd, so everything works in powers of 2.
So starting with 0.18 in your constant, you will see that raising it by a stop will give you .36 as a floating point number (in linear space), while your f/stop will be f/11 and so on.If you set your center stop to 0 (see below) you will get a relative readout in EVs, where EV 0 again equals 18% constant gray.

In other words. Setting the center f-stop to 0 means that in a neutral plate, the middle gray in the macbeth chart will equal to exposure value 0. EV 0 corresponds to an exposure time of 1 sec and an aperture of f/1.0.
This will set the sun usually around EV12-17 and the sky EV1-4 , depending on cloud coverage.
To switch Foundry’s Nuke’s SpotMeter to return the EV of an image, click on the main viewport, and then press s, this opens the viewer’s properties. Now set the center f-stop to 0 in there. And the SpotMeter in the viewport will change from aperture and fstops to EV.
-
What’s the Difference Between Ray Casting, Ray Tracing, Path Tracing and Rasterization? Physical light tracing…
Read more: What’s the Difference Between Ray Casting, Ray Tracing, Path Tracing and Rasterization? Physical light tracing…RASTERIZATION
Rasterisation (or rasterization) is the task of taking the information described in a vector graphics format OR the vertices of triangles making 3D shapes and converting them into a raster image (a series of pixels, dots or lines, which, when displayed together, create the image which was represented via shapes), or in other words “rasterizing” vectors or 3D models onto a 2D plane for display on a computer screen.For each triangle of a 3D shape, you project the corners of the triangle on the virtual screen with some math (projective geometry). Then you have the position of the 3 corners of the triangle on the pixel screen. Those 3 points have texture coordinates, so you know where in the texture are the 3 corners. The cost is proportional to the number of triangles, and is only a little bit affected by the screen resolution.
In computer graphics, a raster graphics or bitmap image is a dot matrix data structure that represents a generally rectangular grid of pixels (points of color), viewable via a monitor, paper, or other display medium.
With rasterization, objects on the screen are created from a mesh of virtual triangles, or polygons, that create 3D models of objects. A lot of information is associated with each vertex, including its position in space, as well as information about color, texture and its “normal,” which is used to determine the way the surface of an object is facing.
Computers then convert the triangles of the 3D models into pixels, or dots, on a 2D screen. Each pixel can be assigned an initial color value from the data stored in the triangle vertices.
Further pixel processing or “shading,” including changing pixel color based on how lights in the scene hit the pixel, and applying one or more textures to the pixel, combine to generate the final color applied to a pixel.
The main advantage of rasterization is its speed. However, rasterization is simply the process of computing the mapping from scene geometry to pixels and does not prescribe a particular way to compute the color of those pixels. So it cannot take shading, especially the physical light, into account and it cannot promise to get a photorealistic output. That’s a big limitation of rasterization.
There are also multiple problems:
If you have two triangles one is behind the other, you will draw twice all the pixels. you only keep the pixel from the triangle that is closer to you (Z-buffer), but you still do the work twice.
The borders of your triangles are jagged as it is hard to know if a pixel is in the triangle or out. You can do some smoothing on those, that is anti-aliasing.
You have to handle every triangles (including the ones behind you) and then see that they do not touch the screen at all. (we have techniques to mitigate this where we only look at triangles that are in the field of view)
Transparency is hard to handle (you can’t just do an average of the color of overlapping transparent triangles, you have to do it in the right order)


RAY CASTING
It is almost the exact reverse of rasterization: you start from the virtual screen instead of the vector or 3D shapes, and you project a ray, starting from each pixel of the screen, until it intersect with a triangle.The cost is directly correlated to the number of pixels in the screen and you need a really cheap way of finding the first triangle that intersect a ray. In the end, it is more expensive than rasterization but it will, by design, ignore the triangles that are out of the field of view.
You can use it to continue after the first triangle it hit, to take a little bit of the color of the next one, etc… This is useful to handle the border of the triangle cleanly (less jagged) and to handle transparency correctly.
RAYTRACING


Same idea as ray casting except once you hit a triangle you reflect on it and go into a different direction. The number of reflection you allow is the “depth” of your ray tracing. The color of the pixel can be calculated, based off the light source and all the polygons it had to reflect off of to get to that screen pixel.The easiest way to think of ray tracing is to look around you, right now. The objects you’re seeing are illuminated by beams of light. Now turn that around and follow the path of those beams backwards from your eye to the objects that light interacts with. That’s ray tracing.
Ray tracing is eye-oriented process that needs walking through each pixel looking for what object should be shown there, which is also can be described as a technique that follows a beam of light (in pixels) from a set point and simulates how it reacts when it encounters objects.
Compared with rasterization, ray tracing is hard to be implemented in real time, since even one ray can be traced and processed without much trouble, but after one ray bounces off an object, it can turn into 10 rays, and those 10 can turn into 100, 1000…The increase is exponential, and the the calculation for all these rays will be time consuming.
Historically, computer hardware hasn’t been fast enough to use these techniques in real time, such as in video games. Moviemakers can take as long as they like to render a single frame, so they do it offline in render farms. Video games have only a fraction of a second. As a result, most real-time graphics rely on the another technique called rasterization.

PATH TRACING
Path tracing can be used to solve more complex lighting situations.
Path tracing is a type of ray tracing. When using path tracing for rendering, the rays only produce a single ray per bounce. The rays do not follow a defined line per bounce (to a light, for example), but rather shoot off in a random direction. The path tracing algorithm then takes a random sampling of all of the rays to create the final image. This results in sampling a variety of different types of lighting.When a ray hits a surface it doesn’t trace a path to every light source, instead it bounces the ray off the surface and keeps bouncing it until it hits a light source or exhausts some bounce limit.
It then calculates the amount of light transferred all the way to the pixel, including any color information gathered from surfaces along the way.
It then averages out the values calculated from all the paths that were traced into the scene to get the final pixel color value.It requires a ton of computing power and if you don’t send out enough rays per pixel or don’t trace the paths far enough into the scene then you end up with a very spotty image as many pixels fail to find any light sources from their rays. So when you increase the the samples per pixel, you can see the image quality becomes better and better.
Ray tracing tends to be more efficient than path tracing. Basically, the render time of a ray tracer depends on the number of polygons in the scene. The more polygons you have, the longer it will take.
Meanwhile, the rendering time of a path tracer can be indifferent to the number of polygons, but it is related to light situation: If you add a light, transparency, translucence, or other shader effects, the path tracer will slow down considerably.
blogs.nvidia.com/blog/2018/03/19/whats-difference-between-ray-tracing-rasterization/
https://en.wikipedia.org/wiki/Rasterisation
https://www.quora.com/Whats-the-difference-between-ray-tracing-and-path-tracing


COLLECTIONS
| Featured AI
| Design And Composition
| Explore posts
POPULAR SEARCHES
unreal | pipeline | virtual production | free | learn | photoshop | 360 | macro | google | nvidia | resolution | open source | hdri | real-time | photography basics | nuke
FEATURED POSTS
-
RawTherapee – a free, open source, cross-platform raw image and HDRi processing program
-
The CG Career YouTube channel is live!
-
Kling 1.6 and competitors – advanced tests and comparisons
-
Photography basics: Production Rendering Resolution Charts
-
Rec-2020 – TVs new color gamut standard used by Dolby Vision?
-
Gamma correction
-
Godot Cheat Sheets
-
Emmanuel Tsekleves – Writing Research Papers
Social Links
DISCLAIMER – Links and images on this website may be protected by the respective owners’ copyright. All data submitted by users through this site shall be treated as freely available to share.
