


COMPOSITION
-
7 Commandments of Film Editing and composition
Read more: 7 Commandments of Film Editing and composition
1. Watch every frame of raw footage twice. On the second time, take notes. If you don’t do this and try to start developing a scene premature, then it’s a big disservice to yourself and to the director, actors and production crew.
2. Nurture the relationships with the director. You are the secondary person in the relationship. Be calm and continually offer solutions. Get the main intention of the film as soon as possible from the director.
3. Organize your media so that you can find any shot instantly.
4. Factor in extra time for renders, exports, errors and crashes.
5. Attempt edits and ideas that shouldn’t work. It just might work. Until you do it and watch it, you won’t know. Don’t rule out ideas just because they don’t make sense in your mind.
6. Spend more time on your audio. It’s the glue of your edit. AUDIO SAVES EVERYTHING. Create fluid and seamless audio under your video.
7. Make cuts for the scene, but always in context for the whole film. Have a macro and a micro view at all times.


DESIGN
-
Mike Mitchell x Marvel x Mondo – Iconic portraits of Marvel’s huge stable of heroes and villains
Read more: Mike Mitchell x Marvel x Mondo – Iconic portraits of Marvel’s huge stable of heroes and villainshttps://mondoshop.com/blogs/gallery/16910155-mike-mitchell-x-marvel-x-mondo
https://time.com/69659/marvel-comics-mike-mitchell-artist-portraits/


COLOR
-
HDR and Color
Read more: HDR and Colorhttps://www.soundandvision.com/content/nits-and-bits-hdr-and-color
In HD we often refer to the range of available colors as a color gamut. Such a color gamut is typically plotted on a two-dimensional diagram, called a CIE chart, as shown in at the top of this blog. Each color is characterized by its x/y coordinates.

Good enough for government work, perhaps. But for HDR, with its higher luminance levels and wider color, the gamut becomes three-dimensional.

For HDR the color gamut therefore becomes a characteristic we now call the color volume. It isn’t easy to show color volume on a two-dimensional medium like the printed page or a computer screen, but one method is shown below. As the luminance becomes higher, the picture eventually turns to white. As it becomes darker, it fades to black. The traditional color gamut shown on the CIE chart is simply a slice through this color volume at a selected luminance level, such as 50%.
Three different color volumes—we still refer to them as color gamuts though their third dimension is important—are currently the most significant. The first is BT.709 (sometimes referred to as Rec.709), the color gamut used for pre-UHD/HDR formats, including standard HD.
The largest is known as BT.2020; it encompasses (roughly) the range of colors visible to the human eye (though ET might find it insufficient!).
Between these two is the color gamut used in digital cinema, known as DCI-P3.

sRGB

D65

-
Mysterious animation wins best illusion of 2011 – Motion silencing illusion
Read more: Mysterious animation wins best illusion of 2011 – Motion silencing illusionThe 2011 Best Illusion of the Year uses motion to render color changes invisible, and so reveals a quirk in our visual systems that is new to scientists.
https://en.wikipedia.org/wiki/Motion_silencing_illusion
“It is a really beautiful effect, revealing something about how our visual system works that we didn’t know before,” said Daniel Simons, a professor at the University of Illinois, Champaign-Urbana. Simons studies visual cognition, and did not work on this illusion. Before its creation, scientists didn’t know that motion had this effect on perception, Simons said.
A viewer stares at a speck at the center of a ring of colored dots, which continuously change color. When the ring begins to rotate around the speck, the color changes appear to stop. But this is an illusion. For some reason, the motion causes our visual system to ignore the color changes. (You can, however, see the color changes if you follow the rotating circles with your eyes.)

-
Victor Perez – ACES Color Management in DaVinci Resolve
Read more: Victor Perez – ACES Color Management in DaVinci Resolvehttpv://www.youtube.com/watch?v=i–TS88-6xA
-
Tobia Montanari – Memory Colors: an essential tool for Colorists
Read more: Tobia Montanari – Memory Colors: an essential tool for Coloristshttps://www.tobiamontanari.com/memory-colors-an-essential-tool-for-colorists/
“Memory colors are colors that are universally associated with specific objects, elements or scenes in our environment. They are the colors that we expect to see in specific situations: these colors are based on our expectation of how certain objects should look based on our past experiences and memories.
For instance, we associate specific hues, saturation and brightness values with human skintones and a slight variation can significantly affect the way we perceive a scene.
Similarly, we expect blue skies to have a particular hue, green trees to be a specific shade and so on.
Memory colors live inside of our brains and we often impose them onto what we see. By considering them during the grading process, the resulting image will be more visually appealing and won’t distract the viewer from the intended message of the story. Even a slight deviation from memory colors in a movie can create a sense of discordance, ultimately detracting from the viewer’s experience.”
-
Virtual Production volumes study
Read more: Virtual Production volumes studyColor Fidelity in LED Volumes
https://theasc.com/articles/color-fidelity-in-led-volumes
Virtual Production Glossary
https://vpglossary.com/What is Virtual Production – In depth analysis
https://www.leadingledtech.com/what-is-a-led-virtual-production-studio-in-depth-technical-analysis/
A comparison of LED panels for use in Virtual Production:
Findings and recommendations
https://eprints.bournemouth.ac.uk/36826/1/LED_Comparison_White_Paper%281%29.pdf -
Victor Perez – The Color Management Handbook for Visual Effects Artists
Read more: Victor Perez – The Color Management Handbook for Visual Effects ArtistsDigital Color Principles, Color Management Fundamentals & ACES Workflows

-
Björn Ottosson – How software gets color wrong
Read more: Björn Ottosson – How software gets color wronghttps://bottosson.github.io/posts/colorwrong/
Most software around us today are decent at accurately displaying colors. Processing of colors is another story unfortunately, and is often done badly.
To understand what the problem is, let’s start with an example of three ways of blending green and magenta:
- Perceptual blend – A smooth transition using a model designed to mimic human perception of color. The blending is done so that the perceived brightness and color varies smoothly and evenly.
- Linear blend – A model for blending color based on how light behaves physically. This type of blending can occur in many ways naturally, for example when colors are blended together by focus blur in a camera or when viewing a pattern of two colors at a distance.
- sRGB blend – This is how colors would normally be blended in computer software, using sRGB to represent the colors.

Let’s look at some more examples of blending of colors, to see how these problems surface more practically. The examples use strong colors since then the differences are more pronounced. This is using the same three ways of blending colors as the first example.

Instead of making it as easy as possible to work with color, most software make it unnecessarily hard, by doing image processing with representations not designed for it. Approximating the physical behavior of light with linear RGB models is one easy thing to do, but more work is needed to create image representations tailored for image processing and human perception.
Also see:
-
Sensitivity of human eye
Read more: Sensitivity of human eyehttp://www.wikilectures.eu/index.php/Spectral_sensitivity_of_the_human_eye
http://www.normankoren.com/Human_spectral_sensitivity_small.jpg
Spectral sensitivity of eye is influenced by light intensity. And the light intensity determines the level of activity of cones cell and rod cell. This is the main characteristic of human vision. Sensitivity to individual colors, in other words, wavelengths of the light spectrum, is explained by the RGB (red-green-blue) theory. This theory assumed that there are three kinds of cones. It’s selectively sensitive to red (700-630 nm), green (560-500 nm), and blue (490-450 nm) light. And their mutual interaction allow to perceive all colors of the spectrum.
http://weeklysciencequiz.blogspot.com/2013/01/violet-skies-are-for-birds.html

Sensitivity of human eye Sensitivity of human eyes to light increase with the decrease in light intensity. In day-light condition, the cones cell is responding to this condition. And the eye is most sensitive at 555 nm. In darkness condition, the rod cell is responding to this condition. And the eye is most sensitive at 507 nm.
As light intensity decreases, cone function changes more effective way. And when decrease the light intensity, it prompt to accumulation of rhodopsin. Furthermore, in activates rods, it allow to respond to stimuli of light in much lower intensity.

The three curves in the figure above shows the normalized response of an average human eye to various amounts of ambient light. The shift in sensitivity occurs because two types of photoreceptors called cones and rods are responsible for the eye’s response to light. The curve on the right shows the eye’s response under normal lighting conditions and this is called the photopic response. The cones respond to light under these conditions.
As mentioned previously, cones are composed of three different photo pigments that enable color perception. This curve peaks at 555 nanometers, which means that under normal lighting conditions, the eye is most sensitive to a yellowish-green color. When the light levels drop to near total darkness, the response of the eye changes significantly as shown by the scotopic response curve on the left. At this level of light, the rods are most active and the human eye is more sensitive to the light present, and less sensitive to the range of color. Rods are highly sensitive to light but are comprised of a single photo pigment, which accounts for the loss in ability to discriminate color. At this very low light level, sensitivity to blue, violet, and ultraviolet is increased, but sensitivity to yellow and red is reduced. The heavier curve in the middle represents the eye’s response at the ambient light level found in a typical inspection booth. This curve peaks at 550 nanometers, which means the eye is most sensitive to yellowish-green color at this light level. Fluorescent penetrant inspection materials are designed to fluoresce at around 550 nanometers to produce optimal sensitivity under dim lighting conditions.


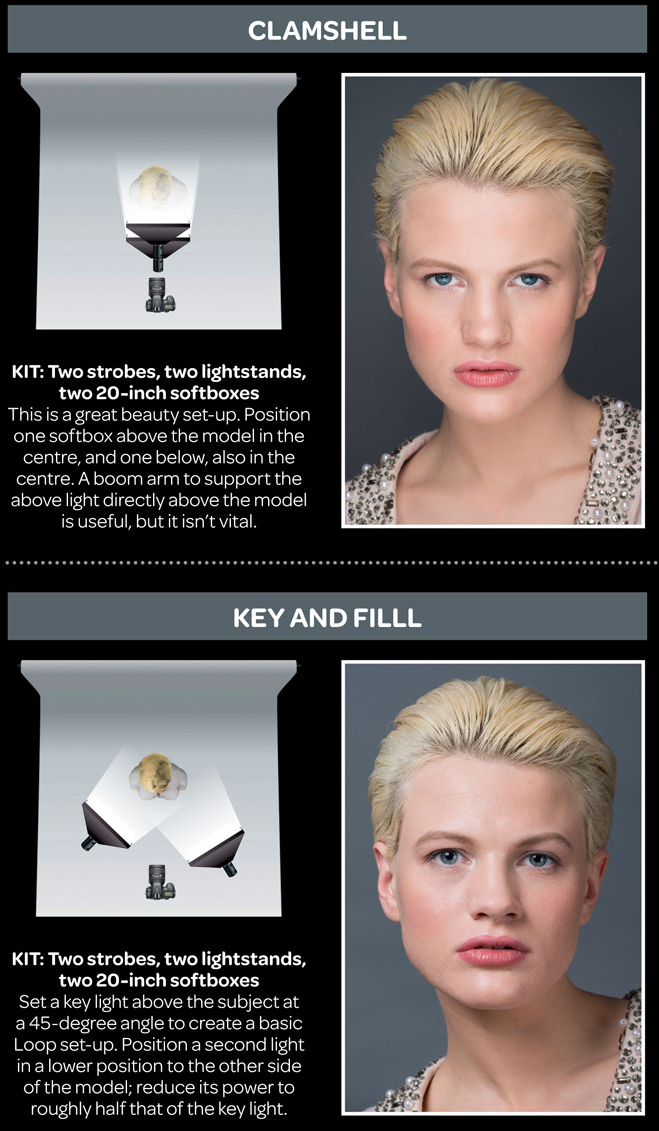
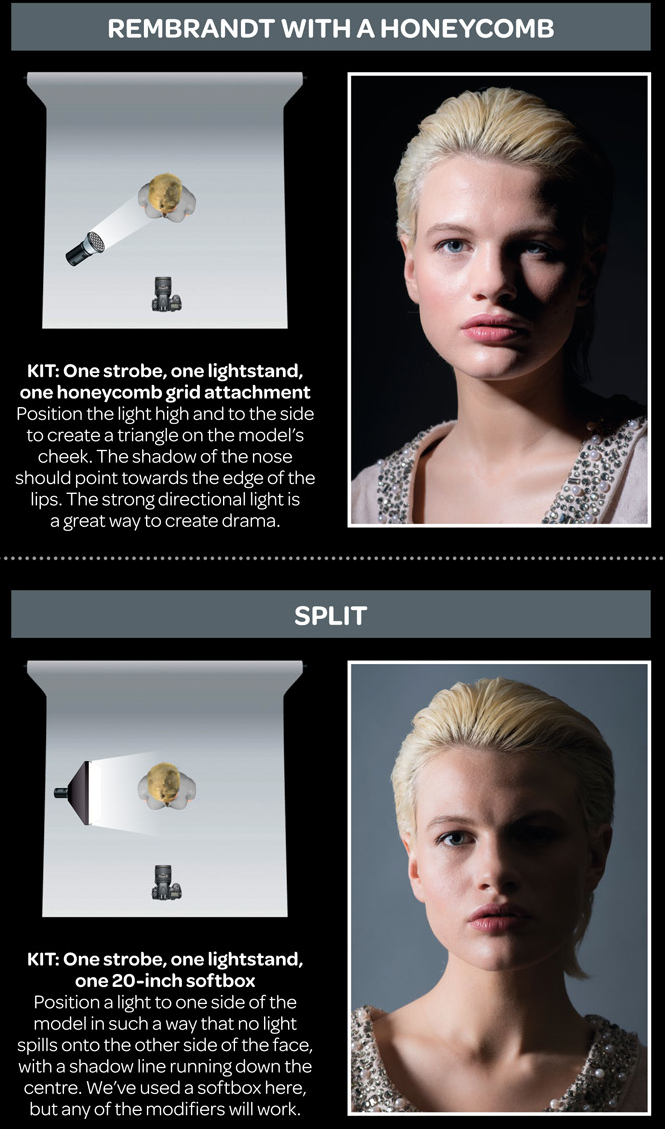
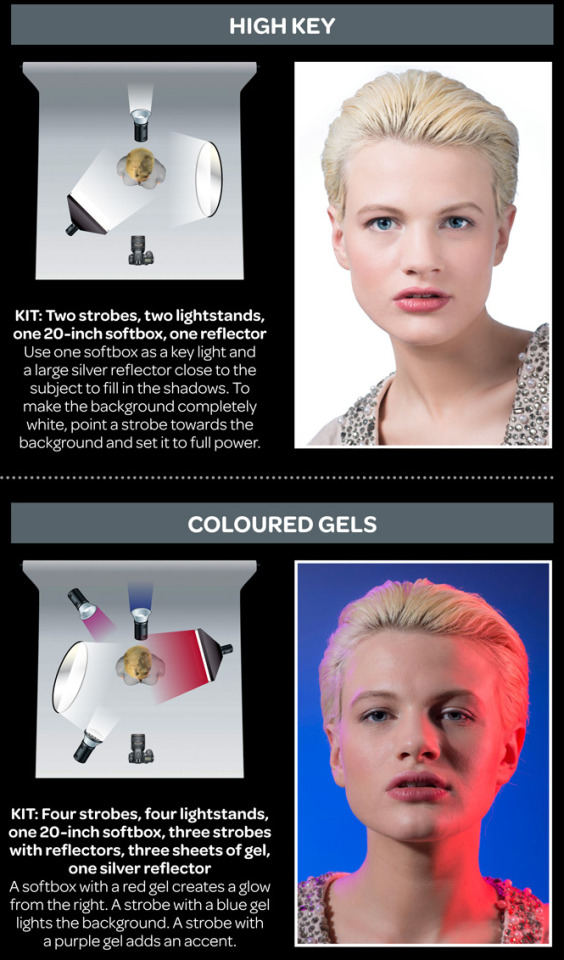
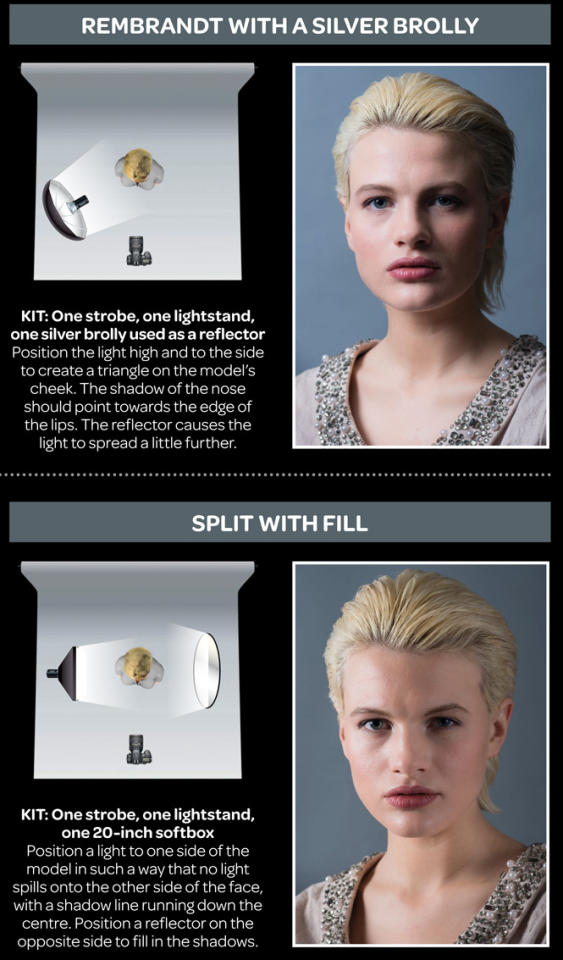
LIGHTING
-
LUX vs LUMEN vs NITS vs CANDELA – What is the difference
Read more: LUX vs LUMEN vs NITS vs CANDELA – What is the differenceMore details here: Lumens vs Candelas (candle) vs Lux vs FootCandle vs Watts vs Irradiance vs Illuminance


https://www.inhouseav.com.au/blog/beginners-guide-nits-lumens-brightness/

Candela
Candela is the basic unit of measure of the entire volume of light intensity from any point in a single direction from a light source. Note the detail: it measures the total volume of light within a certain beam angle and direction.
While the luminance of starlight is around 0.001 cd/m2, that of a sunlit scene is around 100,000 cd/m2, which is a hundred millions times higher. The luminance of the sun itself is approximately 1,000,000,000 cd/m2.NIT
https://en.wikipedia.org/wiki/Candela_per_square_metre
The candela per square metre (symbol: cd/m2) is the unit of luminance in the International System of Units (SI). The unit is based on the candela, the SI unit of luminous intensity, and the square metre, the SI unit of area. The nit (symbol: nt) is a non-SI name also used for this unit (1 nt = 1 cd/m2).[1] The term nit is believed to come from the Latin word nitēre, “to shine”. As a measure of light emitted per unit area, this unit is frequently used to specify the brightness of a display device.
NIT and cd/m2 (candela power) represent the same thing and can be used interchangeably. One nit is equivalent to one candela per square meter, where the candela is the amount of light which has been emitted by a common tallow candle, but NIT is not part of the International System of Units (abbreviated SI, from Systeme International, in French).
It’s easiest to think of a TV as emitting light directly, in much the same way as the Sun does. Nits are simply the measurement of the level of light (luminance) in a given area which the emitting source sends to your eyes or a camera sensor.
The Nit can be considered a unit of visible-light intensity which is often used to specify the brightness level of an LCD.
1 Nit is approximately equal to 3.426 Lumens. To work out a comparable number of Nits to Lumens, you need to multiply the number of Nits by 3.426. If you know the number of Lumens, and wish to know the Nits, simply divide the number of Lumens by 3.426.
Most consumer desktop LCDs have Nits of 200 to 300, the average TV most likely has an output capability of between 100 and 200 Nits, and an HDR TV ranges from 400 to 1,500 Nits.
Virtual Production sets currently sport around 6000 NIT ceiling and 1000 NIT wall panels.The ambient brightness of a sunny day with clear blue skies is between 7000-10,000 nits (between 3000-7000 nits for overcast skies and indirect sunlight).
A bright sunny day can have specular highlights that reach over 100,000 nits. Direct sunlight is around 1,600,000,000 nits.
10,000 nits is also the typical brightness of a fluorescent tube – bright, but not painful to look at.
https://www.displaydaily.com/article/display-daily/dolby-vision-vs-hdr10-clarified
Tests showed that a “black level” of 0.005 nits (cd/m²) satisfied the vast majority of viewers. While 0.005 nits is very close to true black, Griffis says Dolby can go down to a black of 0.0001 nits, even though there is no need or ability for displays to get that dark today.
How bright is white? Dolby says the range of 0.005 nits – 10,000 nits satisfied 84% of the viewers in their viewing tests.
The brightest consumer HDR displays today are about 1,500 nits. Professional displays where HDR content is color-graded can achieve up to 4,000 nits peak brightness.High brightness that would be in danger of damaging the eye would be in the neighborhood of 250,000 nits.
Lumens
Lumen is a measure of how much light is emitted (luminance, luminous flux) by an object. It indicates the total potential amount of light from a light source that is visible to the human eye.
Lumen is commonly used in the context of light bulbs or video-projectors as a metric for their brightness power.Lumen is used to describe light output, and about video projectors, it is commonly referred to as ANSI Lumens. Simply put, lumens is how to find out how bright a LED display is. The higher the lumens, the brighter to display!
Technically speaking, a Lumen is the SI unit of luminous flux, which is equal to the amount of light which is emitted per second in a unit solid angle of one steradian from a uniform source of one-candela intensity radiating in all directions.
LUX
Lux (lx) or often Illuminance, is a photometric unit along a given area, which takes in account the sensitivity of human eye to different wavelenghts. It is the measure of light at a specific distance within a specific area at that distance. Often used to measure the incidental sun’s intensity.
-
domeble – Hi-Resolution CGI Backplates and 360° HDRI
Read more: domeble – Hi-Resolution CGI Backplates and 360° HDRIWhen collecting hdri make sure the data supports basic metadata, such as:
- Iso
- Aperture
- Exposure time or shutter time
- Color temperature
- Color space Exposure value (what the sensor receives of the sun intensity in lux)
- 7+ brackets (with 5 or 6 being the perceived balanced exposure)
In image processing, computer graphics, and photography, high dynamic range imaging (HDRI or just HDR) is a set of techniques that allow a greater dynamic range of luminances (a Photometry measure of the luminous intensity per unit area of light travelling in a given direction. It describes the amount of light that passes through or is emitted from a particular area, and falls within a given solid angle) between the lightest and darkest areas of an image than standard digital imaging techniques or photographic methods. This wider dynamic range allows HDR images to represent more accurately the wide range of intensity levels found in real scenes ranging from direct sunlight to faint starlight and to the deepest shadows.
The two main sources of HDR imagery are computer renderings and merging of multiple photographs, which in turn are known as low dynamic range (LDR) or standard dynamic range (SDR) images. Tone Mapping (Look-up) techniques, which reduce overall contrast to facilitate display of HDR images on devices with lower dynamic range, can be applied to produce images with preserved or exaggerated local contrast for artistic effect. Photography
In photography, dynamic range is measured in Exposure Values (in photography, exposure value denotes all combinations of camera shutter speed and relative aperture that give the same exposure. The concept was developed in Germany in the 1950s) differences or stops, between the brightest and darkest parts of the image that show detail. An increase of one EV or one stop is a doubling of the amount of light.
The human response to brightness is well approximated by a Steven’s power law, which over a reasonable range is close to logarithmic, as described by the Weber�Fechner law, which is one reason that logarithmic measures of light intensity are often used as well.
HDR is short for High Dynamic Range. It’s a term used to describe an image which contains a greater exposure range than the “black” to “white” that 8 or 16-bit integer formats (JPEG, TIFF, PNG) can describe. Whereas these Low Dynamic Range images (LDR) can hold perhaps 8 to 10 f-stops of image information, HDR images can describe beyond 30 stops and stored in 32 bit images.


COLLECTIONS
| Featured AI
| Design And Composition
| Explore posts
POPULAR SEARCHES
unreal | pipeline | virtual production | free | learn | photoshop | 360 | macro | google | nvidia | resolution | open source | hdri | real-time | photography basics | nuke
FEATURED POSTS
-
Want to build a start up company that lasts? Think three-layer cake
-
Gamma correction
-
Types of AI Explained in a few Minutes – AI Glossary
-
Guide to Prompt Engineering
-
Convert 2D Images to 3D Models
-
QR code logos
-
How to paint a boardgame miniatures
-
Animation/VFX/Game Industry JOB POSTINGS by Chris Mayne
Social Links
DISCLAIMER – Links and images on this website may be protected by the respective owners’ copyright. All data submitted by users through this site shall be treated as freely available to share.
