


COMPOSITION


DESIGN


COLOR
-
OLED vs QLED – What TV is better?
Read more: OLED vs QLED – What TV is better?
Supported by LG, Philips, Panasonic and Sony sell the OLED system TVs.
OLED stands for “organic light emitting diode.”
It is a fundamentally different technology from LCD, the major type of TV today.
OLED is “emissive,” meaning the pixels emit their own light.Samsung is branding its best TVs with a new acronym: “QLED”
QLED (according to Samsung) stands for “quantum dot LED TV.”
It is a variation of the common LED LCD, adding a quantum dot film to the LCD “sandwich.”
QLED, like LCD, is, in its current form, “transmissive” and relies on an LED backlight.OLED is the only technology capable of absolute blacks and extremely bright whites on a per-pixel basis. LCD definitely can’t do that, and even the vaunted, beloved, dearly departed plasma couldn’t do absolute blacks.
QLED, as an improvement over OLED, significantly improves the picture quality. QLED can produce an even wider range of colors than OLED, which says something about this new tech. QLED is also known to produce up to 40% higher luminance efficiency than OLED technology. Further, many tests conclude that QLED is far more efficient in terms of power consumption than its predecessor, OLED.

When analyzing TVs color, it may be beneficial to consider at least 3 elements:
“Color Depth”, “Color Gamut”, and “Dynamic Range”.Color Depth (or “Bit-Depth”, e.g. 8-bit, 10-bit, 12-bit) determines how many distinct color variations (tones/shades) can be viewed on a given display.
Color Gamut (e.g. WCG) determines which specific colors can be displayed from a given “Color Space” (Rec.709, Rec.2020, DCI-P3) (i.e. the color range).
Dynamic Range (SDR, HDR) determines the luminosity range of a specific color – from its darkest shade (or tone) to its brightest.
The overall brightness range of a color will be determined by a display’s “contrast ratio”, that is, the ratio of luminance between the darkest black that can be produced and the brightest white.
Color Volume is the “Color Gamut” + the “Dynamic/Luminosity Range”.
A TV’s Color Volume will not only determine which specific colors can be displayed (the color range) but also that color’s luminosity range, which will have an affect on its “brightness”, and “colorfulness” (intensity and saturation).The better the colour volume in a TV, the closer to life the colours appear.
QLED TV can express nearly all of the colours in the DCI-P3 colour space, and of those colours, express 100% of the colour volume, thereby producing an incredible range of colours.
With OLED TV, when the image is too bright, the percentage of the colours in the colour volume produced by the TV drops significantly. The colours get washed out and can only express around 70% colour volume, making the picture quality drop too.
Note. OLED TV uses organic material, so it may lose colour expression as it ages.
Resources for more reading and comparison below
www.avsforum.com/forum/166-lcd-flat-panel-displays/2812161-what-color-volume.html
www.newtechnologytv.com/qled-vs-oled/
news.samsung.com/za/qled-tv-vs-oled-tv
www.cnet.com/news/qled-vs-oled-samsungs-tv-tech-and-lgs-tv-tech-are-not-the-same/

-
Photography basics: Lumens vs Candelas (candle) vs Lux vs FootCandle vs Watts vs Irradiance vs Illuminance
Read more: Photography basics: Lumens vs Candelas (candle) vs Lux vs FootCandle vs Watts vs Irradiance vs Illuminancehttps://www.translatorscafe.com/unit-converter/en-US/illumination/1-11/

The power output of a light source is measured using the unit of watts W. This is a direct measure to calculate how much power the light is going to drain from your socket and it is not relatable to the light brightness itself.
The amount of energy emitted from it per second. That energy comes out in a form of photons which we can crudely represent with rays of light coming out of the source. The higher the power the more rays emitted from the source in a unit of time.
Not all energy emitted is visible to the human eye, so we often rely on photometric measurements, which takes in account the sensitivity of human eye to different wavelenghts


Details in the post
(more…) -
Gamma correction
Read more: Gamma correction

http://www.normankoren.com/makingfineprints1A.html#Gammabox
https://en.wikipedia.org/wiki/Gamma_correction
http://www.photoscientia.co.uk/Gamma.htm
https://www.w3.org/Graphics/Color/sRGB.html
http://www.eizoglobal.com/library/basics/lcd_display_gamma/index.html
https://forum.reallusion.com/PrintTopic308094.aspx
Basically, gamma is the relationship between the brightness of a pixel as it appears on the screen, and the numerical value of that pixel. Generally Gamma is just about defining relationships.
Three main types:
– Image Gamma encoded in images
– Display Gammas encoded in hardware and/or viewing time
– System or Viewing Gamma which is the net effect of all gammas when you look back at a final image. In theory this should flatten back to 1.0 gamma.Our eyes, different camera or video recorder devices do not correctly capture luminance. (they are not linear)
Different display devices (monitor, phone screen, TV) do not display luminance correctly neither. So, one needs to correct them, therefore the gamma correction function.The human perception of brightness, under common illumination conditions (not pitch black nor blindingly bright), follows an approximate power function (note: no relation to the gamma function), with greater sensitivity to relative differences between darker tones than between lighter ones, consistent with the Stevens’ power law for brightness perception. If images are not gamma-encoded, they allocate too many bits or too much bandwidth to highlights that humans cannot differentiate, and too few bits or too little bandwidth to shadow values that humans are sensitive to and would require more bits/bandwidth to maintain the same visual quality.
https://blog.amerlux.com/4-things-architects-should-know-about-lumens-vs-perceived-brightness/
cones manage color receptivity, rods determine how large our pupils should be. The larger (more dilated) our pupils are, the more light enters our eyes. In dark situations, our rods dilate our pupils so we can see better. This impacts how we perceive brightness.


https://www.cambridgeincolour.com/tutorials/gamma-correction.htm
A gamma encoded image has to have “gamma correction” applied when it is viewed — which effectively converts it back into light from the original scene. In other words, the purpose of gamma encoding is for recording the image — not for displaying the image. Fortunately this second step (the “display gamma”) is automatically performed by your monitor and video card. The following diagram illustrates how all of this fits together:

Display gamma
The display gamma can be a little confusing because this term is often used interchangeably with gamma correction, since it corrects for the file gamma. This is the gamma that you are controlling when you perform monitor calibration and adjust your contrast setting. Fortunately, the industry has converged on a standard display gamma of 2.2, so one doesn’t need to worry about the pros/cons of different values.Gamma encoding of images is used to optimize the usage of bits when encoding an image, or bandwidth used to transport an image, by taking advantage of the non-linear manner in which humans perceive light and color. Human response to luminance is also biased. Especially sensible to dark areas.
Thus, the human visual system has a non-linear response to the power of the incoming light, so a fixed increase in power will not have a fixed increase in perceived brightness.
We perceive a value as half bright when it is actually 18% of the original intensity not 50%. As such, our perception is not linear.You probably already know that a pixel can have any ‘value’ of Red, Green, and Blue between 0 and 255, and you would therefore think that a pixel value of 127 would appear as half of the maximum possible brightness, and that a value of 64 would represent one-quarter brightness, and so on. Well, that’s just not the case.

Pixar Color Management
https://renderman.pixar.com/color-management
– Why do we need linear gamma?
Because light works linearly and therefore only works properly when it lights linear values.– Why do we need to view in sRGB?
Because the resulting linear image in not suitable for viewing, but contains all the proper data. Pixar’s IT viewer can compensate by showing the rendered image through a sRGB look up table (LUT), which is identical to what will be the final image after the sRGB gamma curve is applied in post.This would be simple enough if every software would play by the same rules, but they don’t. In fact, the default gamma workflow for many 3D software is incorrect. This is where the knowledge of a proper imaging workflow comes in to save the day.
Cathode-ray tubes have a peculiar relationship between the voltage applied to them, and the amount of light emitted. It isn’t linear, and in fact it follows what’s called by mathematicians and other geeks, a ‘power law’ (a number raised to a power). The numerical value of that power is what we call the gamma of the monitor or system.
Thus. Gamma describes the nonlinear relationship between the pixel levels in your computer and the luminance of your monitor (the light energy it emits) or the reflectance of your prints. The equation is,
Luminance = C * value^gamma + black level
– C is set by the monitor Contrast control.
– Value is the pixel level normalized to a maximum of 1. For an 8 bit monitor with pixel levels 0 – 255, value = (pixel level)/255.
– Black level is set by the (misnamed) monitor Brightness control. The relationship is linear if gamma = 1. The chart illustrates the relationship for gamma = 1, 1.5, 1.8 and 2.2 with C = 1 and black level = 0.
Gamma affects middle tones; it has no effect on black or white. If gamma is set too high, middle tones appear too dark. Conversely, if it’s set too low, middle tones appear too light.
The native gamma of monitors– the relationship between grid voltage and luminance– is typically around 2.5, though it can vary considerably. This is well above any of the display standards, so you must be aware of gamma and correct it.
A display gamma of 2.2 is the de facto standard for the Windows operating system and the Internet-standard sRGB color space.
The old standard for Mcintosh and prepress file interchange is 1.8. It is now 2.2 as well.
Video cameras have gammas of approximately 0.45– the inverse of 2.2. The viewing or system gamma is the product of the gammas of all the devices in the system– the image acquisition device (film+scanner or digital camera), color lookup table (LUT), and monitor. System gamma is typically between 1.1 and 1.5. Viewing flare and other factor make images look flat at system gamma = 1.0.
Most laptop LCD screens are poorly suited for critical image editing because gamma is extremely sensitive to viewing angle.
More about screens
https://www.cambridgeincolour.com/tutorials/gamma-correction.htm
CRT Monitors. Due to an odd bit of engineering luck, the native gamma of a CRT is 2.5 — almost the inverse of our eyes. Values from a gamma-encoded file could therefore be sent straight to the screen and they would automatically be corrected and appear nearly OK. However, a small gamma correction of ~1/1.1 needs to be applied to achieve an overall display gamma of 2.2. This is usually already set by the manufacturer’s default settings, but can also be set during monitor calibration.
LCD Monitors. LCD monitors weren’t so fortunate; ensuring an overall display gamma of 2.2 often requires substantial corrections, and they are also much less consistent than CRT’s. LCDs therefore require something called a look-up table (LUT) in order to ensure that input values are depicted using the intended display gamma (amongst other things). See the tutorial on monitor calibration: look-up tables for more on this topic.
About black level (brightness). Your monitor’s brightness control (which should actually be called black level) can be adjusted using the mostly black pattern on the right side of the chart. This pattern contains two dark gray vertical bars, A and B, which increase in luminance with increasing gamma. (If you can’t see them, your black level is way low.) The left bar (A) should be just above the threshold of visibility opposite your chosen gamma (2.2 or 1.8)– it should be invisible where gamma is lower by about 0.3. The right bar (B) should be distinctly visible: brighter than (A), but still very dark. This chart is only for monitors; it doesn’t work on printed media.
The 1.8 and 2.2 gray patterns at the bottom of the image represent a test of monitor quality and calibration. If your monitor is functioning properly and calibrated to gamma = 2.2 or 1.8, the corresponding pattern will appear smooth neutral gray when viewed from a distance. Any waviness, irregularity, or color banding indicates incorrect monitor calibration or poor performance.
Another test to see whether one’s computer monitor is properly hardware adjusted and can display shadow detail in sRGB images properly, they should see the left half of the circle in the large black square very faintly but the right half should be clearly visible. If not, one can adjust their monitor’s contrast and/or brightness setting. This alters the monitor’s perceived gamma. The image is best viewed against a black background.
This procedure is not suitable for calibrating or print-proofing a monitor. It can be useful for making a monitor display sRGB images approximately correctly, on systems in which profiles are not used (for example, the Firefox browser prior to version 3.0 and many others) or in systems that assume untagged source images are in the sRGB colorspace.
On some operating systems running the X Window System, one can set the gamma correction factor (applied to the existing gamma value) by issuing the command xgamma -gamma 0.9 for setting gamma correction factor to 0.9, and xgamma for querying current value of that factor (the default is 1.0). In OS X systems, the gamma and other related screen calibrations are made through the System Preference

https://www.kinematicsoup.com/news/2016/6/15/gamma-and-linear-space-what-they-are-how-they-differ
Linear color space means that numerical intensity values correspond proportionally to their perceived intensity. This means that the colors can be added and multiplied correctly. A color space without that property is called ”non-linear”. Below is an example where an intensity value is doubled in a linear and a non-linear color space. While the corresponding numerical values in linear space are correct, in the non-linear space (gamma = 0.45, more on this later) we can’t simply double the value to get the correct intensity.

The need for gamma arises for two main reasons: The first is that screens have been built with a non-linear response to intensity. The other is that the human eye can tell the difference between darker shades better than lighter shades. This means that when images are compressed to save space, we want to have greater accuracy for dark intensities at the expense of lighter intensities. Both of these problems are resolved using gamma correction, which is to say the intensity of every pixel in an image is put through a power function. Specifically, gamma is the name given to the power applied to the image.
CRT screens, simply by how they work, apply a gamma of around 2.2, and modern LCD screens are designed to mimic that behavior. A gamma of 2.2, the reciprocal of 0.45, when applied to the brightened images will darken them, leaving the original image.
-
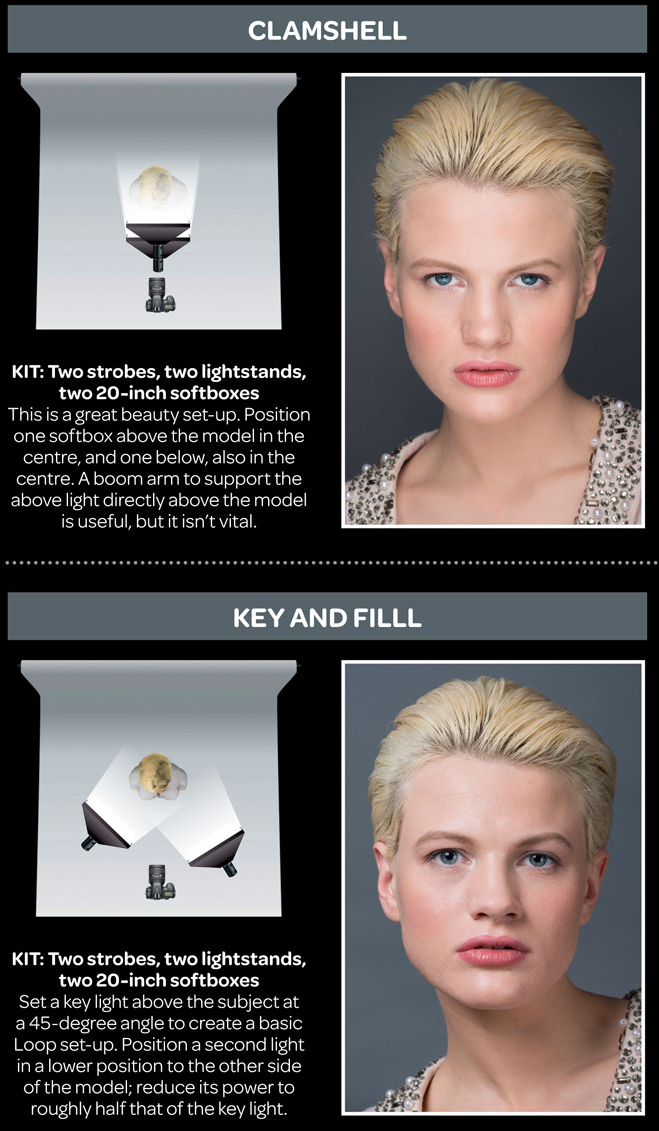
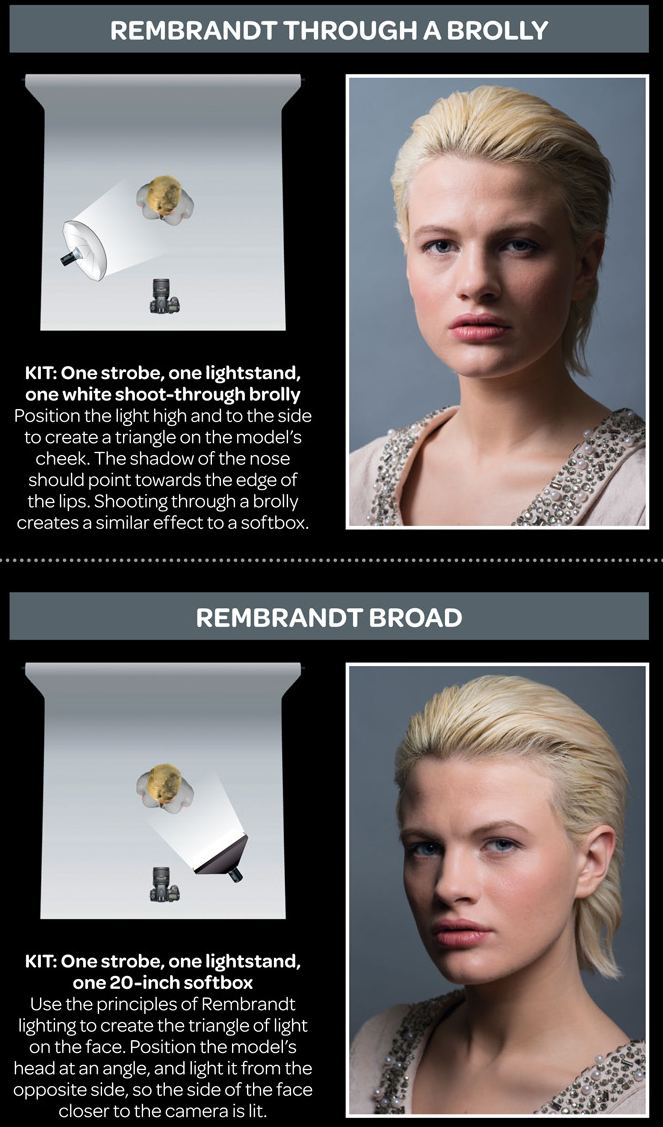
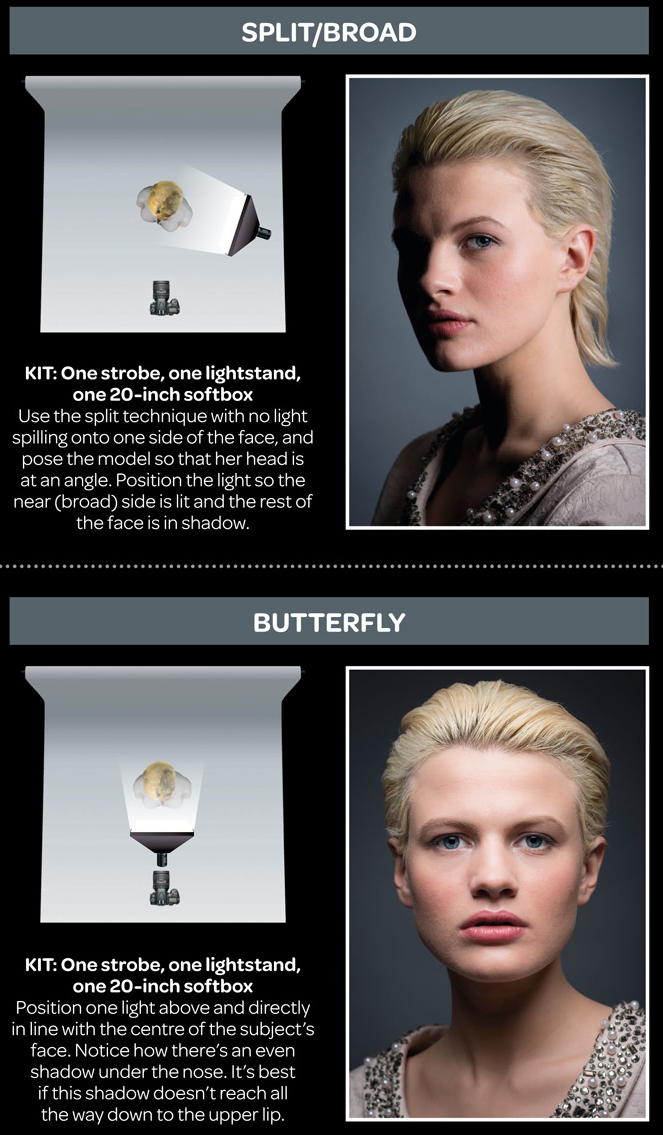
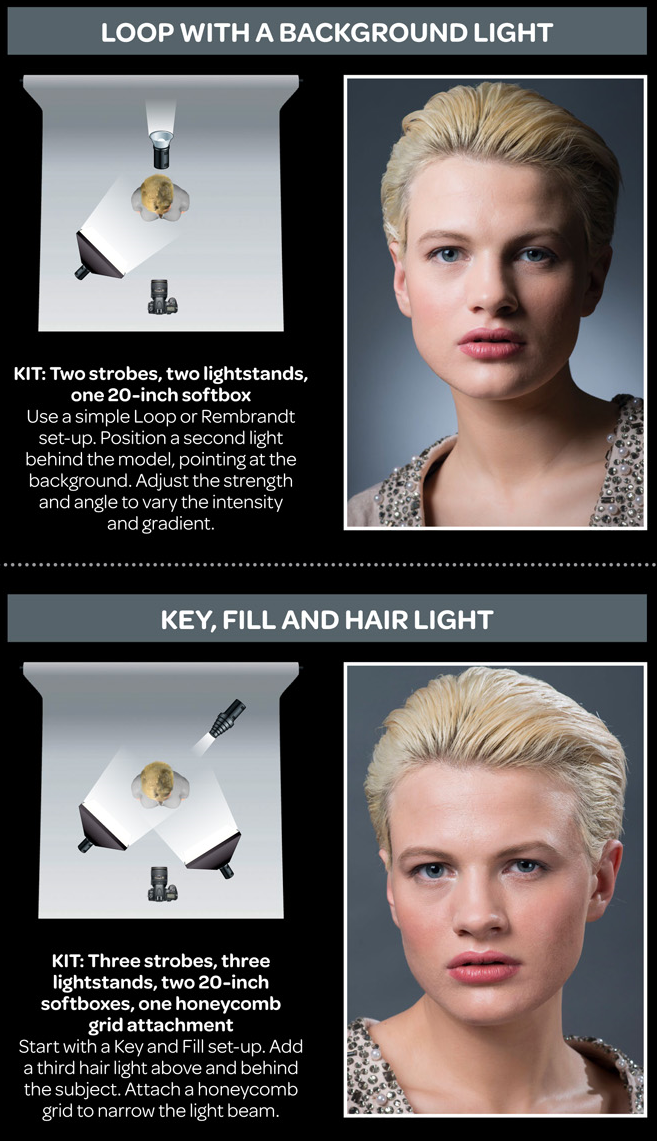
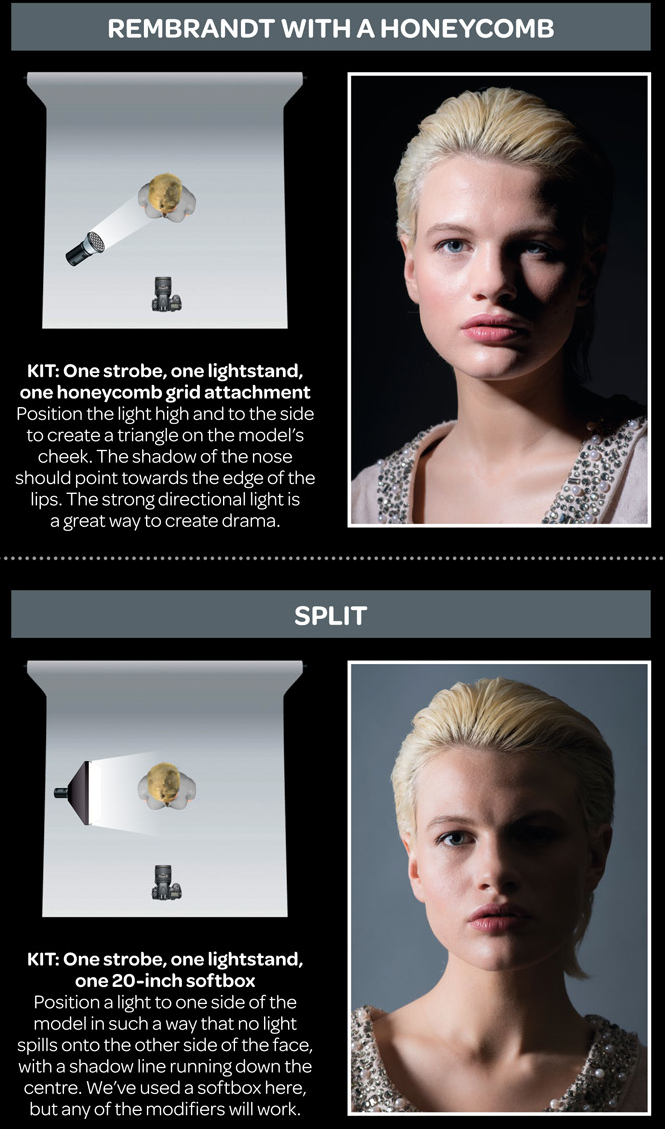
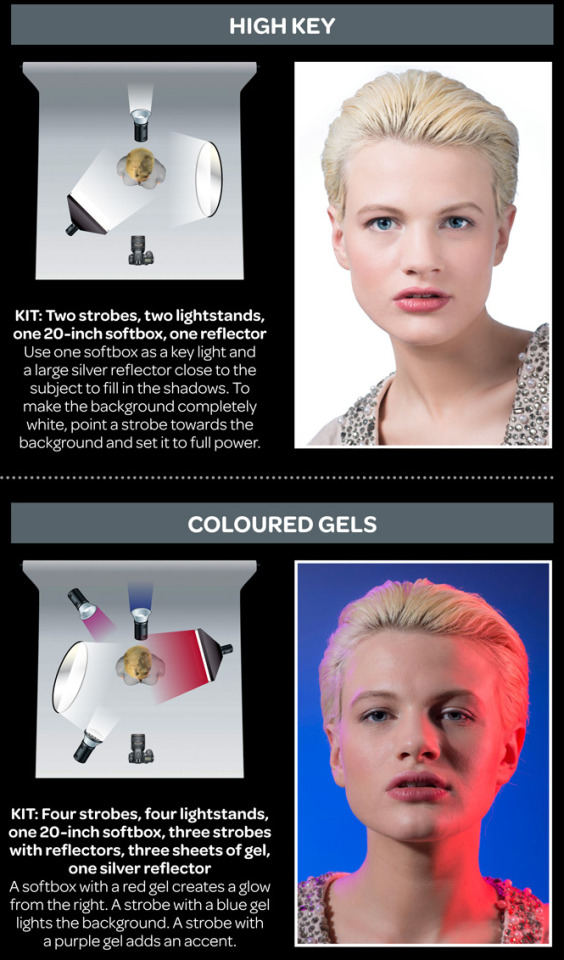
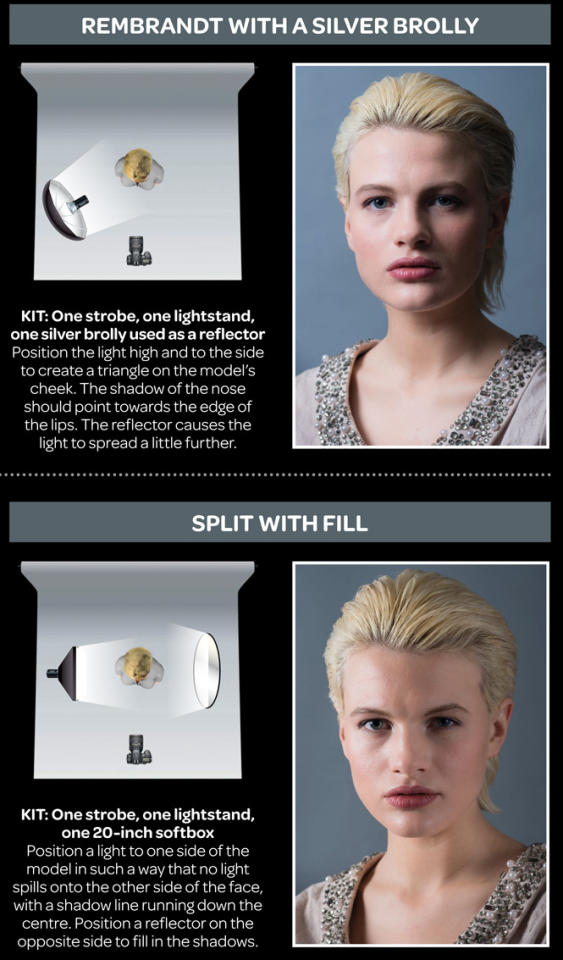
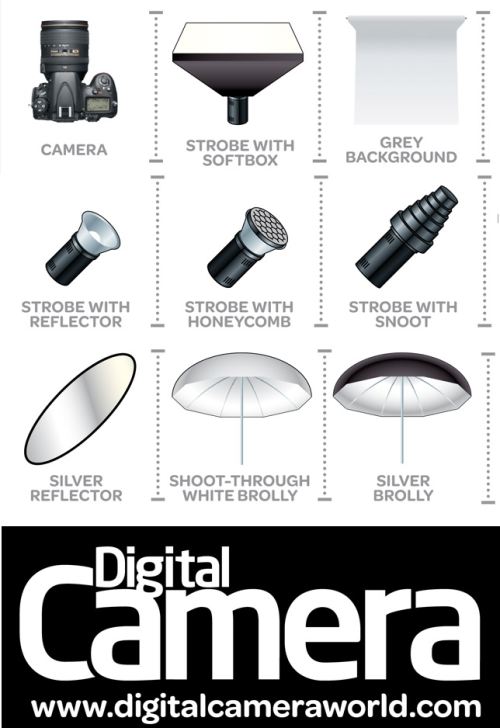
3D Lighting Tutorial by Amaan Kram
Read more: 3D Lighting Tutorial by Amaan Kramhttp://www.amaanakram.com/lightingT/part1.htm
The goals of lighting in 3D computer graphics are more or less the same as those of real world lighting.
Lighting serves a basic function of bringing out, or pushing back the shapes of objects visible from the camera’s view.
It gives a two-dimensional image on the monitor an illusion of the third dimension-depth.But it does not just stop there. It gives an image its personality, its character. A scene lit in different ways can give a feeling of happiness, of sorrow, of fear etc., and it can do so in dramatic or subtle ways. Along with personality and character, lighting fills a scene with emotion that is directly transmitted to the viewer.
Trying to simulate a real environment in an artificial one can be a daunting task. But even if you make your 3D rendering look absolutely photo-realistic, it doesn’t guarantee that the image carries enough emotion to elicit a “wow” from the people viewing it.
Making 3D renderings photo-realistic can be hard. Putting deep emotions in them can be even harder. However, if you plan out your lighting strategy for the mood and emotion that you want your rendering to express, you make the process easier for yourself.
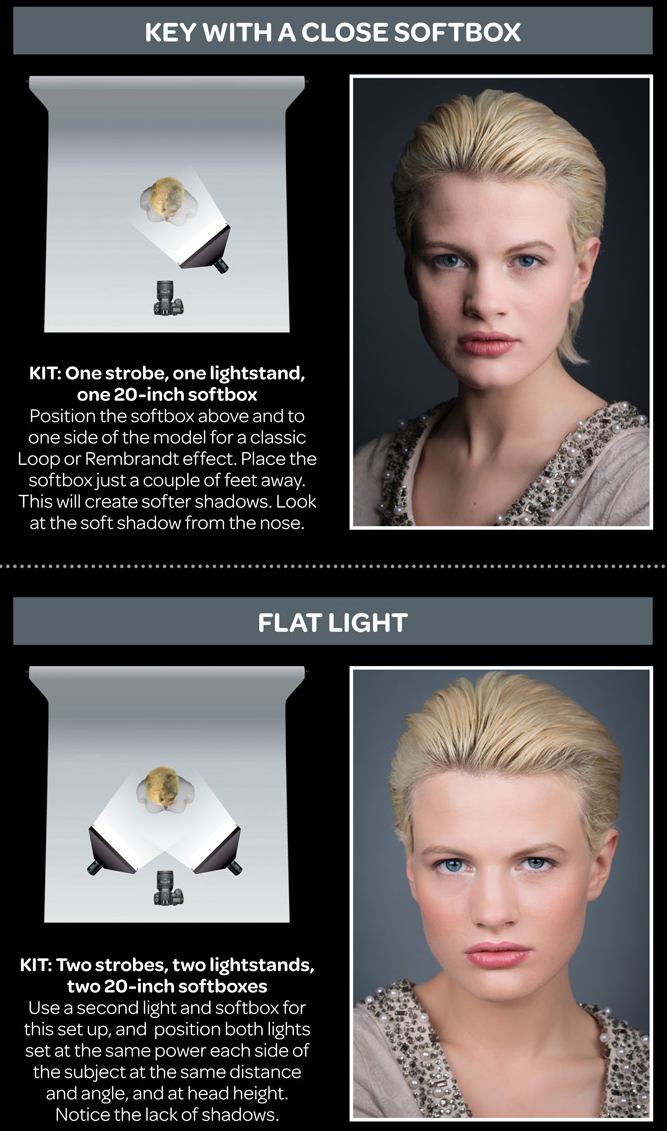
Each light source can be broken down in to 4 distinct components and analyzed accordingly.
· Intensity
· Direction
· Color
· SizeThe overall thrust of this writing is to produce photo-realistic images by applying good lighting techniques.

-
What Is The Resolution and view coverage Of The human Eye. And what distance is TV at best?
Read more: What Is The Resolution and view coverage Of The human Eye. And what distance is TV at best?
https://www.discovery.com/science/mexapixels-in-human-eye
About 576 megapixels for the entire field of view.
Consider a view in front of you that is 90 degrees by 90 degrees, like looking through an open window at a scene. The number of pixels would be:
90 degrees * 60 arc-minutes/degree * 1/0.3 * 90 * 60 * 1/0.3 = 324,000,000 pixels (324 megapixels).At any one moment, you actually do not perceive that many pixels, but your eye moves around the scene to see all the detail you want. But the human eye really sees a larger field of view, close to 180 degrees. Let’s be conservative and use 120 degrees for the field of view. Then we would see:
120 * 120 * 60 * 60 / (0.3 * 0.3) = 576 megapixels.
Or.
7 megapixels for the 2 degree focus arc… + 1 megapixel for the rest.
https://clarkvision.com/articles/eye-resolution.html
Details in the post
-
Colour – MacBeth Chart Checker Detection
Read more: Colour – MacBeth Chart Checker Detectiongithub.com/colour-science/colour-checker-detection
A Python package implementing various colour checker detection algorithms and related utilities.

-
Photography basics: Color Temperature and White Balance
Read more: Photography basics: Color Temperature and White Balance

Color Temperature of a light source describes the spectrum of light which is radiated from a theoretical “blackbody” (an ideal physical body that absorbs all radiation and incident light – neither reflecting it nor allowing it to pass through) with a given surface temperature.
https://en.wikipedia.org/wiki/Color_temperature
Or. Most simply it is a method of describing the color characteristics of light through a numerical value that corresponds to the color emitted by a light source, measured in degrees of Kelvin (K) on a scale from 1,000 to 10,000.
More accurately. The color temperature of a light source is the temperature of an ideal backbody that radiates light of comparable hue to that of the light source.
As such, the color temperature of a light source is a numerical measurement of its color appearance. It is based on the principle that any object will emit light if it is heated to a high enough temperature, and that the color of that light will shift in a predictable manner as the temperature is increased. The system is based on the color changes of a theoretical “blackbody radiator” as it is heated from a cold black to a white hot state.
So, why do we measure the hue of the light as a “temperature”? This was started in the late 1800s, when the British physicist William Kelvin heated a block of carbon. It glowed in the heat, producing a range of different colors at different temperatures. The black cube first produced a dim red light, increasing to a brighter yellow as the temperature went up, and eventually produced a bright blue-white glow at the highest temperatures. In his honor, Color Temperatures are measured in degrees Kelvin, which are a variation on Centigrade degrees. Instead of starting at the temperature water freezes, the Kelvin scale starts at “absolute zero,” which is -273 Centigrade.
More about black bodies here: https://www.pixelsham.com/2013/03/14/black-body-color

Details in the post


![[gamma correction test]](http://www.madore.org/~david/misc/color/gammatest.png "sRGB gamma correction test")


LIGHTING
-
Rendering – BRDF – Bidirectional reflectance distribution function
Read more: Rendering – BRDF – Bidirectional reflectance distribution functionhttp://en.wikipedia.org/wiki/Bidirectional_reflectance_distribution_function
The bidirectional reflectance distribution function is a four-dimensional function that defines how light is reflected at an opaque surface
http://www.cs.ucla.edu/~zhu/tutorial/An_Introduction_to_BRDF-Based_Lighting.pdf
In general, when light interacts with matter, a complicated light-matter dynamic occurs. This interaction depends on the physical characteristics of the light as well as the physical composition and characteristics of the matter.
That is, some of the incident light is reflected, some of the light is transmitted, and another portion of the light is absorbed by the medium itself.
A BRDF describes how much light is reflected when light makes contact with a certain material. Similarly, a BTDF (Bi-directional Transmission Distribution Function) describes how much light is transmitted when light makes contact with a certain material
http://www.cs.princeton.edu/~smr/cs348c-97/surveypaper.html
It is difficult to establish exactly how far one should go in elaborating the surface model. A truly complete representation of the reflective behavior of a surface might take into account such phenomena as polarization, scattering, fluorescence, and phosphorescence, all of which might vary with position on the surface. Therefore, the variables in this complete function would be:
incoming and outgoing angle incoming and outgoing wavelength incoming and outgoing polarization (both linear and circular) incoming and outgoing position (which might differ due to subsurface scattering) time delay between the incoming and outgoing light ray
-
Polarised vs unpolarized filtering
Read more: Polarised vs unpolarized filteringA light wave that is vibrating in more than one plane is referred to as unpolarized light. …
Polarized light waves are light waves in which the vibrations occur in a single plane. The process of transforming unpolarized light into polarized light is known as polarization.

en.wikipedia.org/wiki/Polarizing_filter_(photography)
The most common use of polarized technology is to reduce lighting complexity on the subject.
Details such as glare and hard edges are not removed, but greatly reduced.This method is usually used in VFX to capture raw images with the least amount of specular diffusion or pollution, thus allowing artists to infer detail back through typical shading and rendering techniques and on demand.
Light reflected from a non-metallic surface becomes polarized; this effect is maximum at Brewster’s angle, about 56° from the vertical for common glass.
A polarizer rotated to pass only light polarized in the direction perpendicular to the reflected light will absorb much of it. This absorption allows glare reflected from, for example, a body of water or a road to be reduced. Reflections from shiny surfaces (e.g. vegetation, sweaty skin, water surfaces, glass) are also reduced. This allows the natural color and detail of what is beneath to come through. Reflections from a window into a dark interior can be much reduced, allowing it to be seen through. (The same effects are available for vision by using polarizing sunglasses.)

www.physicsclassroom.com/class/light/u12l1e.cfm
Some of the light coming from the sky is polarized (bees use this phenomenon for navigation). The electrons in the air molecules cause a scattering of sunlight in all directions. This explains why the sky is not dark during the day. But when looked at from the sides, the light emitted from a specific electron is totally polarized.[3] Hence, a picture taken in a direction at 90 degrees from the sun can take advantage of this polarization.

Use of a polarizing filter, in the correct direction, will filter out the polarized component of skylight, darkening the sky; the landscape below it, and clouds, will be less affected, giving a photograph with a darker and more dramatic sky, and emphasizing the clouds.

There are two types of polarizing filters readily available, linear and “circular”, which have exactly the same effect photographically. But the metering and auto-focus sensors in certain cameras, including virtually all auto-focus SLRs, will not work properly with linear polarizers because the beam splitters used to split off the light for focusing and metering are polarization-dependent.
Polarizing filters reduce the light passed through to the film or sensor by about one to three stops (2–8×) depending on how much of the light is polarized at the filter angle selected. Auto-exposure cameras will adjust for this by widening the aperture, lengthening the time the shutter is open, and/or increasing the ASA/ISO speed of the camera.
www.adorama.com/alc/nd-filter-vs-polarizer-what%25e2%2580%2599s-the-difference
Neutral Density (ND) filters help control image exposure by reducing the light that enters the camera so that you can have more control of your depth of field and shutter speed. Polarizers or polarizing filters work in a similar way, but the difference is that they selectively let light waves of a certain polarization pass through. This effect helps create more vivid colors in an image, as well as manage glare and reflections from water surfaces. Both are regarded as some of the best filters for landscape and travel photography as they reduce the dynamic range in high-contrast images, thus enabling photographers to capture more realistic and dramatic sceneries.
shopfelixgray.com/blog/polarized-vs-non-polarized-sunglasses/
www.eyebuydirect.com/blog/difference-polarized-nonpolarized-sunglasses/

-
HDRI shooting and editing by Xuan Prada and Greg Zaal
Read more: HDRI shooting and editing by Xuan Prada and Greg Zaalwww.xuanprada.com/blog/2014/11/3/hdri-shooting
http://blog.gregzaal.com/2016/03/16/make-your-own-hdri/
http://blog.hdrihaven.com/how-to-create-high-quality-hdri/
Shooting checklist
- Full coverage of the scene (fish-eye shots)
- Backplates for look-development (including ground or floor)
- Macbeth chart for white balance
- Grey ball for lighting calibration
- Chrome ball for lighting orientation
- Basic scene measurements
- Material samples
- Individual HDR artificial lighting sources if required
Methodology
- Plant the tripod where the action happens, stabilise it and level it
- Set manual focus
- Set white balance
- Set ISO
- Set raw+jpg
- Set apperture
- Metering exposure
- Set neutral exposure
- Read histogram and adjust neutral exposure if necessary
- Shot slate (operator name, location, date, time, project code name, etc)
- Set auto bracketing
- Shot 5 to 7 exposures with 3 stops difference covering the whole environment
- Place the aromatic kit where the tripod was placed, and take 3 exposures. Keep half of the grey sphere hit by the sun and half in shade.
- Place the Macbeth chart 1m away from tripod on the floor and take 3 exposures
- Take backplates and ground/floor texture references
- Shoot reference materials
- Write down measurements of the scene, specially if you are shooting interiors.
- If shooting artificial lights take HDR samples of each individual lighting source.
Exposures starting point
- Day light sun visible ISO 100 F22
- Day light sun hidden ISO 100 F16
- Cloudy ISO 320 F16
- Sunrise/Sunset ISO 100 F11
- Interior well lit ISO 320 F16
- Interior ambient bright ISO 320 F10
- Interior bad light ISO 640 F10
- Interior ambient dark ISO 640 F8
- Low light situation ISO 640 F5
NOTE: The goal is to clean the initial individual brackets before or at merging time as much as possible.
This means:- keeping original shooting metadata
- de-fringing
- removing aberration (through camera lens data or automatically)
- at 32 bit
- in ACEScg (or ACES) wherever possible

Here are the tips for using the chromatic ball in VFX projects, written in English:
https://www.linkedin.com/posts/bellrodrigo_here-are-the-tips-for-using-the-chromatic-activity-7200950595438940160-AGBpTips for Using the Chromatic Ball in VFX Projects**
The chromatic ball is an invaluable tool in VFX work, helping to capture lighting and reflection data crucial for integrating CGI elements seamlessly. Here are some tips to maximize its effectiveness:
1. **Positioning**:
– Place the chromatic ball in the same lighting conditions as the main subject. Ensure it is visible in the camera frame but not obstructing the main action.
– Ideally, place the ball where the CGI elements will be integrated to match the lighting and reflections accurately.2. **Recording Reference Footage**:
– Capture reference footage of the chromatic ball at the beginning and end of each scene or lighting setup. This ensures you have consistent lighting data for the entire shoot.3. **Consistent Angles**:
– Use consistent camera angles and heights when recording the chromatic ball. This helps in comparing and matching lighting setups across different shots.4. **Combine with a Gray Ball**:
– Use a gray ball alongside the chromatic ball. The gray ball provides a neutral reference for exposure and color balance, complementing the chromatic ball’s reflection data.5. **Marking Positions**:
– Mark the position of the chromatic ball on the set to ensure consistency when shooting multiple takes or different camera angles.6. **Lighting Analysis**:
– Analyze the chromatic ball footage to understand the light sources, intensity, direction, and color temperature. This information is crucial for creating realistic CGI lighting and shadows.7. **Reflection Analysis**:
– Use the chromatic ball to capture the environment’s reflections. This helps in accurately reflecting the CGI elements within the same scene, making them blend seamlessly.8. **Use HDRI**:
– Capture High Dynamic Range Imagery (HDRI) of the chromatic ball. HDRI provides detailed lighting information and can be used to light CGI scenes with greater realism.9. **Communication with VFX Team**:
– Ensure that the VFX team is aware of the chromatic ball’s data and how it was captured. Clear communication ensures that the data is used effectively in post-production.10. **Post-Production Adjustments**:
– In post-production, use the chromatic ball data to adjust the CGI elements’ lighting and reflections. This ensures that the final output is visually cohesive and realistic. -
Practical Aspects of Spectral Data and LEDs in Digital Content Production and Virtual Production – SIGGRAPH 2022
Read more: Practical Aspects of Spectral Data and LEDs in Digital Content Production and Virtual Production – SIGGRAPH 2022
Comparison to the commercial side

https://www.ecolorled.com/blog/detail/what-is-rgb-rgbw-rgbic-strip-lights
RGBW (RGB + White) LED strip uses a 4-in-1 LED chip made up of red, green, blue, and white.
RGBWW (RGB + White + Warm White) LED strip uses either a 5-in-1 LED chip with red, green, blue, white, and warm white for color mixing. The only difference between RGBW and RGBWW is the intensity of the white color. The term RGBCCT consists of RGB and CCT. CCT (Correlated Color Temperature) means that the color temperature of the led strip light can be adjusted to change between warm white and white. Thus, RGBWW strip light is another name of RGBCCT strip.
RGBCW is the acronym for Red, Green, Blue, Cold, and Warm. These 5-in-1 chips are used in supper bright smart LED lighting products
-
Photography basics: How Exposure Stops (Aperture, Shutter Speed, and ISO) Affect Your Photos – cheat sheet cards
Read more: Photography basics: How Exposure Stops (Aperture, Shutter Speed, and ISO) Affect Your Photos – cheat sheet cardsAlso see:
https://www.pixelsham.com/2018/11/22/exposure-value-measurements/
https://www.pixelsham.com/2016/03/03/f-stop-vs-t-stop/

An exposure stop is a unit measurement of Exposure as such it provides a universal linear scale to measure the increase and decrease in light, exposed to the image sensor, due to changes in shutter speed, iso and f-stop.
+-1 stop is a doubling or halving of the amount of light let in when taking a photo
1 EV (exposure value) is just another way to say one stop of exposure change.
https://www.photographymad.com/pages/view/what-is-a-stop-of-exposure-in-photography
Same applies to shutter speed, iso and aperture.
Doubling or halving your shutter speed produces an increase or decrease of 1 stop of exposure.
Doubling or halving your iso speed produces an increase or decrease of 1 stop of exposure.


Because of the way f-stop numbers are calculated (ratio of focal length/lens diameter, where focal length is the distance between the lens and the sensor), an f-stop doesn’t relate to a doubling or halving of the value, but to the doubling/halving of the area coverage of a lens in relation to its focal length. And as such, to a multiplying or dividing by 1.41 (the square root of 2). For example, going from f/2.8 to f/4 is a decrease of 1 stop because 4 = 2.8 * 1.41. Changing from f/16 to f/11 is an increase of 1 stop because 11 = 16 / 1.41.


A wider aperture means that light proceeding from the foreground, subject, and background is entering at more oblique angles than the light entering less obliquely.
Consider that absolutely everything is bathed in light, therefore light bouncing off of anything is effectively omnidirectional. Your camera happens to be picking up a tiny portion of the light that’s bouncing off into infinity.
Now consider that the wider your iris/aperture, the more of that omnidirectional light you’re picking up:

When you have a very narrow iris you are eliminating a lot of oblique light. Whatever light enters, from whatever distance, enters moderately parallel as a whole. When you have a wide aperture, much more light is entering at a multitude of angles. Your lens can only focus the light from one depth – the foreground/background appear blurred because it cannot be focused on.
https://frankwhitephotography.com/index.php?id=28:what-is-a-stop-in-photography

The great thing about stops is that they give us a way to directly compare shutter speed, aperture diameter, and ISO speed. This means that we can easily swap these three components about while keeping the overall exposure the same.
http://lifehacker.com/how-aperture-shutter-speed-and-iso-affect-pictures-sh-1699204484

https://www.techradar.com/how-to/the-exposure-triangle

https://www.videoschoolonline.com/what-is-an-exposure-stop
Note. All three of these measurements (aperture, shutter, iso) have full stops, half stops and third stops, but if you look at the numbers they aren’t always consistent. For example, a one third stop between ISO100 and ISO 200 would be ISO133, yet most cameras are marked at ISO125.

Third-stops are especially important as they’re the increment that most cameras use for their settings. These are just imaginary divisions in each stop.
From a practical standpoint manufacturers only standardize the full stops, meaning that while they try and stay somewhat consistent there is some rounding up going on between the smaller numbers.


Note that ND Filters directly modify the exposure triangle.


-
Cinematographers Blueprint 300dpi poster
Read more: Cinematographers Blueprint 300dpi posterThe 300dpi digital poster is now available to all PixelSham.com subscribers.

If you have already subscribed and wish a copy, please send me a note through the contact page.
-
HDRI Median Cut plugin
Read more: HDRI Median Cut pluginwww.hdrlabs.com/picturenaut/plugins.html

Note. The Median Cut algorithm is typically used for color quantization, which involves reducing the number of colors in an image while preserving its visual quality. It doesn’t directly provide a way to identify the brightest areas in an image. However, if you’re interested in identifying the brightest areas, you might want to look into other methods like thresholding, histogram analysis, or edge detection, through openCV for example.
Here is an openCV example:
# bottom left coordinates = 0,0 import numpy as np import cv2 # Load the HDR or EXR image image = cv2.imread('your_image_path.exr', cv2.IMREAD_UNCHANGED) # Load as-is without modification # Calculate the luminance from the HDR channels (assuming RGB format) luminance = np.dot(image[..., :3], [0.299, 0.587, 0.114]) # Set a threshold value based on estimated EV threshold_value = 2.4 # Estimated threshold value based on 4.8 EV # Apply the threshold to identify bright areas # Theluminancearray contains the calculated luminance values for each pixel in the image. # Thethreshold_valueis a user-defined value that represents a cutoff point, separating "bright" and "dark" areas in terms of perceived luminance.thresholded = (luminance > threshold_value) * 255 # Convert the thresholded image to uint8 for contour detection thresholded = thresholded.astype(np.uint8) # Find contours of the bright areas contours, _ = cv2.findContours(thresholded, cv2.RETR_EXTERNAL, cv2.CHAIN_APPROX_SIMPLE) # Create a list to store the bounding boxes of bright areas bright_areas = [] # Iterate through contours and extract bounding boxes for contour in contours: x, y, w, h = cv2.boundingRect(contour) # Adjust y-coordinate based on bottom-left origin y_bottom_left_origin = image.shape[0] - (y + h) bright_areas.append((x, y_bottom_left_origin, x + w, y_bottom_left_origin + h)) # Store as (x1, y1, x2, y2) # Print the identified bright areas print("Bright Areas (x1, y1, x2, y2):") for area in bright_areas: print(area)More details
Luminance and Exposure in an EXR Image:
- An EXR (Extended Dynamic Range) image format is often used to store high dynamic range (HDR) images that contain a wide range of luminance values, capturing both dark and bright areas.
- Luminance refers to the perceived brightness of a pixel in an image. In an RGB image, luminance is often calculated using a weighted sum of the red, green, and blue channels, where different weights are assigned to each channel to account for human perception.
- In an EXR image, the pixel values can represent radiometrically accurate scene values, including actual radiance or irradiance levels. These values are directly related to the amount of light emitted or reflected by objects in the scene.
The luminance line is calculating the luminance of each pixel in the image using a weighted sum of the red, green, and blue channels. The three float values [0.299, 0.587, 0.114] are the weights used to perform this calculation.
These weights are based on the concept of luminosity, which aims to approximate the perceived brightness of a color by taking into account the human eye’s sensitivity to different colors. The values are often derived from the NTSC (National Television System Committee) standard, which is used in various color image processing operations.
Here’s the breakdown of the float values:
- 0.299: Weight for the red channel.
- 0.587: Weight for the green channel.
- 0.114: Weight for the blue channel.
The weighted sum of these channels helps create a grayscale image where the pixel values represent the perceived brightness. This technique is often used when converting a color image to grayscale or when calculating luminance for certain operations, as it takes into account the human eye’s sensitivity to different colors.
For the threshold, remember that the exact relationship between EV values and pixel values can depend on the tone-mapping or normalization applied to the HDR image, as well as the dynamic range of the image itself.
To establish a relationship between exposure and the threshold value, you can consider the relationship between linear and logarithmic scales:
- Linear and Logarithmic Scales:
- Exposure values in an EXR image are often represented in logarithmic scales, such as EV (exposure value). Each increment in EV represents a doubling or halving of the amount of light captured.
- Threshold values for luminance thresholding are usually linear, representing an actual luminance level.
- Conversion Between Scales:
- To establish a mathematical relationship, you need to convert between the logarithmic exposure scale and the linear threshold scale.
- One common method is to use a power function. For instance, you can use a power function to convert EV to a linear intensity value.
threshold_value = base_value * (2 ** EV)Here,
EVis the exposure value,base_valueis a scaling factor that determines the relationship between EV and threshold_value, and2 ** EVis used to convert the logarithmic EV to a linear intensity value. - Choosing the Base Value:
- The
base_valuefactor should be determined based on the dynamic range of your EXR image and the specific luminance values you are dealing with. - You may need to experiment with different values of
base_valueto achieve the desired separation of bright areas from the rest of the image.
- The
Let’s say you have an EXR image with a dynamic range of 12 EV, which is a common range for many high dynamic range images. In this case, you want to set a threshold value that corresponds to a certain number of EV above the middle gray level (which is often considered to be around 0.18).
Here’s an example of how you might determine a
base_valueto achieve this:# Define the dynamic range of the image in EV dynamic_range = 12 # Choose the desired number of EV above middle gray for thresholding desired_ev_above_middle_gray = 2 # Calculate the threshold value based on the desired EV above middle gray threshold_value = 0.18 * (2 ** (desired_ev_above_middle_gray / dynamic_range)) print("Threshold Value:", threshold_value)


COLLECTIONS
| Featured AI
| Design And Composition
| Explore posts
POPULAR SEARCHES
unreal | pipeline | virtual production | free | learn | photoshop | 360 | macro | google | nvidia | resolution | open source | hdri | real-time | photography basics | nuke
FEATURED POSTS
Social Links
DISCLAIMER – Links and images on this website may be protected by the respective owners’ copyright. All data submitted by users through this site shall be treated as freely available to share.
