


COMPOSITION
-
Composition – cinematography Cheat Sheet
Read more: Composition – cinematography Cheat Sheet
Where is our eye attracted first? Why?
Size. Focus. Lighting. Color.
Size. Mr. White (Harvey Keitel) on the right.
Focus. He’s one of the two objects in focus.
Lighting. Mr. White is large and in focus and Mr. Pink (Steve Buscemi) is highlighted by
a shaft of light.
Color. Both are black and white but the read on Mr. White’s shirt now really stands out.
What type of lighting?-> High key lighting.
Features bright, even illumination and few conspicuous shadows. This lighting key is often used in musicals and comedies.Low key lighting
Features diffused shadows and atmospheric pools of light. This lighting key is often used in mysteries and thrillers.High contrast lighting
Features harsh shafts of lights and dramatic streaks of blackness. This type of lighting is often used in tragedies and melodramas.What type of shot?
Extreme long shot
Taken from a great distance, showing much of the locale. Ifpeople are included in these shots, they usually appear as mere specks-> Long shot
Corresponds to the space between the audience and the stage in a live theater. The long shots show the characters and some of the locale.Full shot
Range with just enough space to contain the human body in full. The full shot shows the character and a minimal amount of the locale.Medium shot
Shows the human figure from the knees or waist up.Close-Up
Concentrates on a relatively small object and show very little if any locale.Extreme close-up
Focuses on an unnaturally small portion of an object, giving that part great detail and symbolic significance.What angle?
Bird’s-eye view.
The shot is photographed directly from above. This type of shot can be disorienting, and the people photographed seem insignificant.High angle.
This angle reduces the size of the objects photographed. A person photographed from this angle seems harmless and insignificant, but to a lesser extent than with the bird’s-eye view.-> Eye-level shot.
The clearest view of an object, but seldom intrinsically dramatic, because it tends to be the norm.Low angle.
This angle increases high and a sense of verticality, heightening the importance of the object photographed. A person shot from this angle is given a sense of power and respect.Oblique angle.
For this angle, the camera is tilted laterally, giving the image a slanted appearance. Oblique angles suggest tension, transition, a impending movement. They are also called canted or dutch angles.What is the dominant color?
The use of color in this shot is symbolic. The scene is set in warehouse. Both the set and characters are blues, blacks and whites.
This was intentional allowing for the scenes and shots with blood to have a great level of contrast.
What is the Lens/Filter/Stock?
Telephoto lens.
A lens that draws objects closer but also diminishes the illusion of depth.Wide-angle lens.
A lens that takes in a broad area and increases the illusion of depth but sometimes distorts the edges of the image.Fast film stock.
Highly sensitive to light, it can register an image with little illumination. However, the final product tends to be grainy.Slow film stock.
Relatively insensitive to light, it requires a great deal of illumination. The final product tends to look polished.The lens is not wide-angle because there isn’t a great sense of depth, nor are several planes in focus. The lens is probably long but not necessarily a telephoto lens because the depth isn’t inordinately compressed.
The stock is fast because of the grainy quality of the image.
Subsidiary Contrast; where does the eye go next?
The two guns.
How much visual information is packed into the image? Is the texture stark, moderate, or highly detailed?
Minimalist clutter in the warehouse allows a focus on a character driven thriller.
What is the Composition?
Horizontal.
Compositions based on horizontal lines seem visually at rest and suggest placidity or peacefulness.Vertical.
Compositions based on vertical lines seem visually at rest and suggest strength.-> Diagonal.
Compositions based on diagonal, or oblique, lines seem dynamic and suggest tension or anxiety.-> Binary. Binary structures emphasize parallelism.
Triangle.
Triadic compositions stress the dynamic interplay among three mainCircle.
Circular compositions suggest security and enclosure.Is the form open or closed? Does the image suggest a window that arbitrarily isolates a fragment of the scene? Or a proscenium arch, in which the visual elements are carefully arranged and held in balance?
The most nebulous of all the categories of mise en scene, the type of form is determined by how consciously structured the mise en scene is. Open forms stress apparently simple techniques, because with these unself-conscious methods the filmmaker is able to emphasize the immediate, the familiar, the intimate aspects of reality. In open-form images, the frame tends to be deemphasized. In closed form images, all the necessary information is carefully structured within the confines of the frame. Space seems enclosed and self-contained rather than continuous.
Could argue this is a proscenium arch because this is such a classic shot with parallels and juxtapositions.
Is the framing tight or loose? Do the character have no room to move around, or can they move freely without impediments?
Shots where the characters are placed at the edges of the frame and have little room to move around within the frame are considered tight.
Longer shots, in which characters have room to move around within the frame, are considered loose and tend to suggest freedom.
Center-framed giving us the entire scene showing isolation, place and struggle.
Depth of Field. On how many planes is the image composed (how many are in focus)? Does the background or foreground comment in any way on the mid-ground?
Standard DOF, one background and clearly defined foreground.
Which way do the characters look vis-a-vis the camera?
An actor can be photographed in any of five basic positions, each conveying different psychological overtones.
Full-front (facing the camera):
the position with the most intimacy. The character is looking in our direction, inviting our complicity.Quarter Turn:
the favored position of most filmmakers. This position offers a high degree of intimacy but with less emotional involvement than the full-front.-> Profile (looking of the frame left or right):
More remote than the quarter turn, the character in profile seems unaware of being observed, lost in his or her own thoughts.Three-quarter Turn:
More anonymous than the profile, this position is useful for conveying a character’s unfriendly or antisocial feelings, for in effect, the character is partially turning his or her back on us, rejecting our interest.Back to Camera:
The most anonymous of all positions, this position is often used to suggest a character’s alienation from the world. When a character has his or her back to the camera, we can only guess what’s taking place internally, conveying a sense of concealment, or mystery.How much space is there between the characters?
Extremely close, for a gunfight.
The way people use space can be divided into four proxemic patterns.
Intimate distances.
The intimate distance ranges from skin contact to about eighteen inches away. This is the distance of physical involvement–of love, comfort, and tenderness between individuals.-> Personal distances.
The personal distance ranges roughly from eighteen inches away to about four feet away. These distances tend to be reserved for friends and acquaintances. Personal distances preserve the privacy between individuals, yet these rages don’t necessarily suggest exclusion, as intimate distances often do.Social distances.
The social distance rages from four feet to about twelve feet. These distances are usually reserved for impersonal business and casual social gatherings. It’s a friendly range in most cases, yet somewhat more formal than the personal distance.Public distances.
The public distance extends from twelve feet to twenty-five feet or more. This range tends to be formal and rather detached. -
9 Best Hacks to Make a Cinematic Video with Any Camera
Read more: 9 Best Hacks to Make a Cinematic Video with Any Camerahttps://www.flexclip.com/learn/cinematic-video.html
- Frame Your Shots to Create Depth
- Create Shallow Depth of Field
- Avoid Shaky Footage and Use Flexible Camera Movements
- Properly Use Slow Motion
- Use Cinematic Lighting Techniques
- Apply Color Grading
- Use Cinematic Music and SFX
- Add Cinematic Fonts and Text Effects
- Create the Cinematic Bar at the Top and the Bottom

-
Photography basics: Camera Aspect Ratio, Sensor Size and Depth of Field – resolutions
Read more: Photography basics: Camera Aspect Ratio, Sensor Size and Depth of Field – resolutionshttp://www.shutterangle.com/2012/cinematic-look-aspect-ratio-sensor-size-depth-of-field/
http://www.shutterangle.com/2012/film-video-aspect-ratio-artistic-choice/


DESIGN
-
The 7 key elements of brand identity design + 10 corporate identity examples
Read more: The 7 key elements of brand identity design + 10 corporate identity exampleswww.lucidpress.com/blog/the-7-key-elements-of-brand-identity-design
1. Clear brand purpose and positioning
2. Thorough market research
3. Likable brand personality
4. Memorable logo
5. Attractive color palette
6. Professional typography
7. On-brand supporting graphics


COLOR
-
StudioBinder.com – CRI color rendering index
Read more: StudioBinder.com – CRI color rendering indexwww.studiobinder.com/blog/what-is-color-rendering-index
“The Color Rendering Index is a measurement of how faithfully a light source reveals the colors of whatever it illuminates, it describes the ability of a light source to reveal the color of an object, as compared to the color a natural light source would provide. The highest possible CRI is 100. A CRI of 100 generally refers to a perfect black body, like a tungsten light source or the sun. ”


www.pixelsham.com/2021/04/28/types-of-film-lights-and-their-efficiency
-
SecretWeapons MixBox – a practical library for paint-like digital color mixing
Read more: SecretWeapons MixBox – a practical library for paint-like digital color mixingInternally, Mixbox treats colors as real-life pigments using the Kubelka & Munk theory to predict realistic color behavior.
https://scrtwpns.com/mixbox/painter/
https://scrtwpns.com/mixbox.pdf
https://github.com/scrtwpns/mixbox
https://scrtwpns.com/mixbox/docs/

-
Anders Langlands – Render Color Spaces
Read more: Anders Langlands – Render Color Spaceshttps://www.colour-science.org/anders-langlands/
This page compares images rendered in Arnold using spectral rendering and different sets of colourspace primaries: Rec.709, Rec.2020, ACES and DCI-P3. The SPD data for the GretagMacbeth Color Checker are the measurements of Noburu Ohta, taken from Mansencal, Mauderer and Parsons (2014) colour-science.org.

-
Practical Aspects of Spectral Data and LEDs in Digital Content Production and Virtual Production – SIGGRAPH 2022
Read more: Practical Aspects of Spectral Data and LEDs in Digital Content Production and Virtual Production – SIGGRAPH 2022
Comparison to the commercial side

https://www.ecolorled.com/blog/detail/what-is-rgb-rgbw-rgbic-strip-lights
RGBW (RGB + White) LED strip uses a 4-in-1 LED chip made up of red, green, blue, and white.
RGBWW (RGB + White + Warm White) LED strip uses either a 5-in-1 LED chip with red, green, blue, white, and warm white for color mixing. The only difference between RGBW and RGBWW is the intensity of the white color. The term RGBCCT consists of RGB and CCT. CCT (Correlated Color Temperature) means that the color temperature of the led strip light can be adjusted to change between warm white and white. Thus, RGBWW strip light is another name of RGBCCT strip.
RGBCW is the acronym for Red, Green, Blue, Cold, and Warm. These 5-in-1 chips are used in supper bright smart LED lighting products
-
Is a MacBeth Colour Rendition Chart the Safest Way to Calibrate a Camera?
Read more: Is a MacBeth Colour Rendition Chart the Safest Way to Calibrate a Camera?www.colour-science.org/posts/the-colorchecker-considered-mostly-harmless/
“Unless you have all the relevant spectral measurements, a colour rendition chart should not be used to perform colour-correction of camera imagery but only for white balancing and relative exposure adjustments.”
“Using a colour rendition chart for colour-correction might dramatically increase error if the scene light source spectrum is different from the illuminant used to compute the colour rendition chart’s reference values.”
“other factors make using a colour rendition chart unsuitable for camera calibration:
– Uncontrolled geometry of the colour rendition chart with the incident illumination and the camera.
– Unknown sample reflectances and ageing as the colour of the samples vary with time.
– Low samples count.
– Camera noise and flare.
– Etc…“Those issues are well understood in the VFX industry, and when receiving plates, we almost exclusively use colour rendition charts to white balance and perform relative exposure adjustments, i.e. plate neutralisation.”
-
Gamma correction
Read more: Gamma correction

http://www.normankoren.com/makingfineprints1A.html#Gammabox
https://en.wikipedia.org/wiki/Gamma_correction
http://www.photoscientia.co.uk/Gamma.htm
https://www.w3.org/Graphics/Color/sRGB.html
http://www.eizoglobal.com/library/basics/lcd_display_gamma/index.html
https://forum.reallusion.com/PrintTopic308094.aspx
Basically, gamma is the relationship between the brightness of a pixel as it appears on the screen, and the numerical value of that pixel. Generally Gamma is just about defining relationships.
Three main types:
– Image Gamma encoded in images
– Display Gammas encoded in hardware and/or viewing time
– System or Viewing Gamma which is the net effect of all gammas when you look back at a final image. In theory this should flatten back to 1.0 gamma.Our eyes, different camera or video recorder devices do not correctly capture luminance. (they are not linear)
Different display devices (monitor, phone screen, TV) do not display luminance correctly neither. So, one needs to correct them, therefore the gamma correction function.The human perception of brightness, under common illumination conditions (not pitch black nor blindingly bright), follows an approximate power function (note: no relation to the gamma function), with greater sensitivity to relative differences between darker tones than between lighter ones, consistent with the Stevens’ power law for brightness perception. If images are not gamma-encoded, they allocate too many bits or too much bandwidth to highlights that humans cannot differentiate, and too few bits or too little bandwidth to shadow values that humans are sensitive to and would require more bits/bandwidth to maintain the same visual quality.
https://blog.amerlux.com/4-things-architects-should-know-about-lumens-vs-perceived-brightness/
cones manage color receptivity, rods determine how large our pupils should be. The larger (more dilated) our pupils are, the more light enters our eyes. In dark situations, our rods dilate our pupils so we can see better. This impacts how we perceive brightness.


https://www.cambridgeincolour.com/tutorials/gamma-correction.htm
A gamma encoded image has to have “gamma correction” applied when it is viewed — which effectively converts it back into light from the original scene. In other words, the purpose of gamma encoding is for recording the image — not for displaying the image. Fortunately this second step (the “display gamma”) is automatically performed by your monitor and video card. The following diagram illustrates how all of this fits together:

Display gamma
The display gamma can be a little confusing because this term is often used interchangeably with gamma correction, since it corrects for the file gamma. This is the gamma that you are controlling when you perform monitor calibration and adjust your contrast setting. Fortunately, the industry has converged on a standard display gamma of 2.2, so one doesn’t need to worry about the pros/cons of different values.Gamma encoding of images is used to optimize the usage of bits when encoding an image, or bandwidth used to transport an image, by taking advantage of the non-linear manner in which humans perceive light and color. Human response to luminance is also biased. Especially sensible to dark areas.
Thus, the human visual system has a non-linear response to the power of the incoming light, so a fixed increase in power will not have a fixed increase in perceived brightness.
We perceive a value as half bright when it is actually 18% of the original intensity not 50%. As such, our perception is not linear.You probably already know that a pixel can have any ‘value’ of Red, Green, and Blue between 0 and 255, and you would therefore think that a pixel value of 127 would appear as half of the maximum possible brightness, and that a value of 64 would represent one-quarter brightness, and so on. Well, that’s just not the case.

Pixar Color Management
https://renderman.pixar.com/color-management
– Why do we need linear gamma?
Because light works linearly and therefore only works properly when it lights linear values.– Why do we need to view in sRGB?
Because the resulting linear image in not suitable for viewing, but contains all the proper data. Pixar’s IT viewer can compensate by showing the rendered image through a sRGB look up table (LUT), which is identical to what will be the final image after the sRGB gamma curve is applied in post.This would be simple enough if every software would play by the same rules, but they don’t. In fact, the default gamma workflow for many 3D software is incorrect. This is where the knowledge of a proper imaging workflow comes in to save the day.
Cathode-ray tubes have a peculiar relationship between the voltage applied to them, and the amount of light emitted. It isn’t linear, and in fact it follows what’s called by mathematicians and other geeks, a ‘power law’ (a number raised to a power). The numerical value of that power is what we call the gamma of the monitor or system.
Thus. Gamma describes the nonlinear relationship between the pixel levels in your computer and the luminance of your monitor (the light energy it emits) or the reflectance of your prints. The equation is,
Luminance = C * value^gamma + black level
– C is set by the monitor Contrast control.
– Value is the pixel level normalized to a maximum of 1. For an 8 bit monitor with pixel levels 0 – 255, value = (pixel level)/255.
– Black level is set by the (misnamed) monitor Brightness control. The relationship is linear if gamma = 1. The chart illustrates the relationship for gamma = 1, 1.5, 1.8 and 2.2 with C = 1 and black level = 0.
Gamma affects middle tones; it has no effect on black or white. If gamma is set too high, middle tones appear too dark. Conversely, if it’s set too low, middle tones appear too light.
The native gamma of monitors– the relationship between grid voltage and luminance– is typically around 2.5, though it can vary considerably. This is well above any of the display standards, so you must be aware of gamma and correct it.
A display gamma of 2.2 is the de facto standard for the Windows operating system and the Internet-standard sRGB color space.
The old standard for Mcintosh and prepress file interchange is 1.8. It is now 2.2 as well.
Video cameras have gammas of approximately 0.45– the inverse of 2.2. The viewing or system gamma is the product of the gammas of all the devices in the system– the image acquisition device (film+scanner or digital camera), color lookup table (LUT), and monitor. System gamma is typically between 1.1 and 1.5. Viewing flare and other factor make images look flat at system gamma = 1.0.
Most laptop LCD screens are poorly suited for critical image editing because gamma is extremely sensitive to viewing angle.
More about screens
https://www.cambridgeincolour.com/tutorials/gamma-correction.htm
CRT Monitors. Due to an odd bit of engineering luck, the native gamma of a CRT is 2.5 — almost the inverse of our eyes. Values from a gamma-encoded file could therefore be sent straight to the screen and they would automatically be corrected and appear nearly OK. However, a small gamma correction of ~1/1.1 needs to be applied to achieve an overall display gamma of 2.2. This is usually already set by the manufacturer’s default settings, but can also be set during monitor calibration.
LCD Monitors. LCD monitors weren’t so fortunate; ensuring an overall display gamma of 2.2 often requires substantial corrections, and they are also much less consistent than CRT’s. LCDs therefore require something called a look-up table (LUT) in order to ensure that input values are depicted using the intended display gamma (amongst other things). See the tutorial on monitor calibration: look-up tables for more on this topic.
About black level (brightness). Your monitor’s brightness control (which should actually be called black level) can be adjusted using the mostly black pattern on the right side of the chart. This pattern contains two dark gray vertical bars, A and B, which increase in luminance with increasing gamma. (If you can’t see them, your black level is way low.) The left bar (A) should be just above the threshold of visibility opposite your chosen gamma (2.2 or 1.8)– it should be invisible where gamma is lower by about 0.3. The right bar (B) should be distinctly visible: brighter than (A), but still very dark. This chart is only for monitors; it doesn’t work on printed media.
The 1.8 and 2.2 gray patterns at the bottom of the image represent a test of monitor quality and calibration. If your monitor is functioning properly and calibrated to gamma = 2.2 or 1.8, the corresponding pattern will appear smooth neutral gray when viewed from a distance. Any waviness, irregularity, or color banding indicates incorrect monitor calibration or poor performance.
Another test to see whether one’s computer monitor is properly hardware adjusted and can display shadow detail in sRGB images properly, they should see the left half of the circle in the large black square very faintly but the right half should be clearly visible. If not, one can adjust their monitor’s contrast and/or brightness setting. This alters the monitor’s perceived gamma. The image is best viewed against a black background.
This procedure is not suitable for calibrating or print-proofing a monitor. It can be useful for making a monitor display sRGB images approximately correctly, on systems in which profiles are not used (for example, the Firefox browser prior to version 3.0 and many others) or in systems that assume untagged source images are in the sRGB colorspace.
On some operating systems running the X Window System, one can set the gamma correction factor (applied to the existing gamma value) by issuing the command xgamma -gamma 0.9 for setting gamma correction factor to 0.9, and xgamma for querying current value of that factor (the default is 1.0). In OS X systems, the gamma and other related screen calibrations are made through the System Preference

https://www.kinematicsoup.com/news/2016/6/15/gamma-and-linear-space-what-they-are-how-they-differ
Linear color space means that numerical intensity values correspond proportionally to their perceived intensity. This means that the colors can be added and multiplied correctly. A color space without that property is called ”non-linear”. Below is an example where an intensity value is doubled in a linear and a non-linear color space. While the corresponding numerical values in linear space are correct, in the non-linear space (gamma = 0.45, more on this later) we can’t simply double the value to get the correct intensity.

The need for gamma arises for two main reasons: The first is that screens have been built with a non-linear response to intensity. The other is that the human eye can tell the difference between darker shades better than lighter shades. This means that when images are compressed to save space, we want to have greater accuracy for dark intensities at the expense of lighter intensities. Both of these problems are resolved using gamma correction, which is to say the intensity of every pixel in an image is put through a power function. Specifically, gamma is the name given to the power applied to the image.
CRT screens, simply by how they work, apply a gamma of around 2.2, and modern LCD screens are designed to mimic that behavior. A gamma of 2.2, the reciprocal of 0.45, when applied to the brightened images will darken them, leaving the original image.
-
Scene Referred vs Display Referred color workflows
Read more: Scene Referred vs Display Referred color workflowsDisplay Referred it is tied to the target hardware, as such it bakes color requirements into every type of media output request.
Scene Referred uses a common unified wide gamut and targeting audience through CDL and DI libraries instead.
So that color information stays untouched and only “transformed” as/when needed.


Sources:
– Victor Perez – Color Management Fundamentals & ACES Workflows in Nuke
– https://z-fx.nl/ColorspACES.pdf
– Wicus


LIGHTING
-
What is the Light Field?
Read more: What is the Light Field?http://lightfield-forum.com/what-is-the-lightfield/
The light field consists of the total of all light rays in 3D space, flowing through every point and in every direction.
How to Record a Light Field
- a single, robotically controlled camera
- a rotating arc of cameras
- an array of cameras or camera modules
- a single camera or camera lens fitted with a microlens array


-
Photography basics: How Exposure Stops (Aperture, Shutter Speed, and ISO) Affect Your Photos – cheat sheet cards
Read more: Photography basics: How Exposure Stops (Aperture, Shutter Speed, and ISO) Affect Your Photos – cheat sheet cardsAlso see:
https://www.pixelsham.com/2018/11/22/exposure-value-measurements/
https://www.pixelsham.com/2016/03/03/f-stop-vs-t-stop/

An exposure stop is a unit measurement of Exposure as such it provides a universal linear scale to measure the increase and decrease in light, exposed to the image sensor, due to changes in shutter speed, iso and f-stop.
+-1 stop is a doubling or halving of the amount of light let in when taking a photo
1 EV (exposure value) is just another way to say one stop of exposure change.
https://www.photographymad.com/pages/view/what-is-a-stop-of-exposure-in-photography
Same applies to shutter speed, iso and aperture.
Doubling or halving your shutter speed produces an increase or decrease of 1 stop of exposure.
Doubling or halving your iso speed produces an increase or decrease of 1 stop of exposure.


Because of the way f-stop numbers are calculated (ratio of focal length/lens diameter, where focal length is the distance between the lens and the sensor), an f-stop doesn’t relate to a doubling or halving of the value, but to the doubling/halving of the area coverage of a lens in relation to its focal length. And as such, to a multiplying or dividing by 1.41 (the square root of 2). For example, going from f/2.8 to f/4 is a decrease of 1 stop because 4 = 2.8 * 1.41. Changing from f/16 to f/11 is an increase of 1 stop because 11 = 16 / 1.41.


A wider aperture means that light proceeding from the foreground, subject, and background is entering at more oblique angles than the light entering less obliquely.
Consider that absolutely everything is bathed in light, therefore light bouncing off of anything is effectively omnidirectional. Your camera happens to be picking up a tiny portion of the light that’s bouncing off into infinity.
Now consider that the wider your iris/aperture, the more of that omnidirectional light you’re picking up:

When you have a very narrow iris you are eliminating a lot of oblique light. Whatever light enters, from whatever distance, enters moderately parallel as a whole. When you have a wide aperture, much more light is entering at a multitude of angles. Your lens can only focus the light from one depth – the foreground/background appear blurred because it cannot be focused on.
https://frankwhitephotography.com/index.php?id=28:what-is-a-stop-in-photography

The great thing about stops is that they give us a way to directly compare shutter speed, aperture diameter, and ISO speed. This means that we can easily swap these three components about while keeping the overall exposure the same.
http://lifehacker.com/how-aperture-shutter-speed-and-iso-affect-pictures-sh-1699204484

https://www.techradar.com/how-to/the-exposure-triangle

https://www.videoschoolonline.com/what-is-an-exposure-stop
Note. All three of these measurements (aperture, shutter, iso) have full stops, half stops and third stops, but if you look at the numbers they aren’t always consistent. For example, a one third stop between ISO100 and ISO 200 would be ISO133, yet most cameras are marked at ISO125.

Third-stops are especially important as they’re the increment that most cameras use for their settings. These are just imaginary divisions in each stop.
From a practical standpoint manufacturers only standardize the full stops, meaning that while they try and stay somewhat consistent there is some rounding up going on between the smaller numbers.


Note that ND Filters directly modify the exposure triangle.


-
Photography basics: Exposure Value vs Photographic Exposure vs Il/Luminance vs Pixel luminance measurements
Read more: Photography basics: Exposure Value vs Photographic Exposure vs Il/Luminance vs Pixel luminance measurementsAlso see: https://www.pixelsham.com/2015/05/16/how-aperture-shutter-speed-and-iso-affect-your-photos/
In photography, exposure value (EV) is a number that represents a combination of a camera’s shutter speed and f-number, such that all combinations that yield the same exposure have the same EV (for any fixed scene luminance).

The EV concept was developed in an attempt to simplify choosing among combinations of equivalent camera settings. Although all camera settings with the same EV nominally give the same exposure, they do not necessarily give the same picture. EV is also used to indicate an interval on the photographic exposure scale. 1 EV corresponding to a standard power-of-2 exposure step, commonly referred to as a stop
EV 0 corresponds to an exposure time of 1 sec and a relative aperture of f/1.0. If the EV is known, it can be used to select combinations of exposure time and f-number.
Note EV does not equal to photographic exposure. Photographic Exposure is defined as how much light hits the camera’s sensor. It depends on the camera settings mainly aperture and shutter speed. Exposure value (known as EV) is a number that represents the exposure setting of the camera.
Thus, strictly, EV is not a measure of luminance (indirect or reflected exposure) or illuminance (incidental exposure); rather, an EV corresponds to a luminance (or illuminance) for which a camera with a given ISO speed would use the indicated EV to obtain the nominally correct exposure. Nonetheless, it is common practice among photographic equipment manufacturers to express luminance in EV for ISO 100 speed, as when specifying metering range or autofocus sensitivity.
The exposure depends on two things: how much light gets through the lenses to the camera’s sensor and for how long the sensor is exposed. The former is a function of the aperture value while the latter is a function of the shutter speed. Exposure value is a number that represents this potential amount of light that could hit the sensor. It is important to understand that exposure value is a measure of how exposed the sensor is to light and not a measure of how much light actually hits the sensor. The exposure value is independent of how lit the scene is. For example a pair of aperture value and shutter speed represents the same exposure value both if the camera is used during a very bright day or during a dark night.
Each exposure value number represents all the possible shutter and aperture settings that result in the same exposure. Although the exposure value is the same for different combinations of aperture values and shutter speeds the resulting photo can be very different (the aperture controls the depth of field while shutter speed controls how much motion is captured).
EV 0.0 is defined as the exposure when setting the aperture to f-number 1.0 and the shutter speed to 1 second. All other exposure values are relative to that number. Exposure values are on a base two logarithmic scale. This means that every single step of EV – plus or minus 1 – represents the exposure (actual light that hits the sensor) being halved or doubled.
https://www.streetdirectory.com/travel_guide/141307/photography/exposure_value_ev_and_exposure_compensation.html
Formula
https://en.wikipedia.org/wiki/Exposure_value
https://www.scantips.com/lights/math.html

which means 2EV = N² / t
where
- N is the relative aperture (f-number) Important: Note that f/stop values must first be squared in most calculations
- t is the exposure time (shutter speed) in seconds
EV 0 corresponds to an exposure time of 1 sec and an aperture of f/1.0.
Example: If f/16 and 1/4 second, then this is:
(N² / t) = (16 × 16 ÷ 1/4) = (16 × 16 × 4) = 1024.
Log₂(1024) is EV 10. Meaning, 210 = 1024.
Collecting photographic exposure using Light Meters
The exposure meter in the camera does not know whether the subject itself is bright or not. It simply measures the amount of light that comes in, and makes a guess based on that. The camera will aim for 18% gray, meaning if you take a photo of an entirely white surface, and an entirely black surface you should get two identical images which both are gray (at least in theory)
https://en.wikipedia.org/wiki/Light_meter
For reflected-light meters, camera settings are related to ISO speed and subject luminance by the reflected-light exposure equation:

where
- N is the relative aperture (f-number)
- t is the exposure time (“shutter speed”) in seconds
- L is the average scene luminance
- S is the ISO arithmetic speed
- K is the reflected-light meter calibration constant
For incident-light meters, camera settings are related to ISO speed and subject illuminance by the incident-light exposure equation:

where
- E is the illuminance (in lux)
- C is the incident-light meter calibration constant
Two values for K are in common use: 12.5 (Canon, Nikon, and Sekonic) and 14 (Minolta, Kenko, and Pentax); the difference between the two values is approximately 1/6 EV.
For C a value of 250 is commonly used.Nonetheless, it is common practice among photographic equipment manufacturers to also express luminance in EV for ISO 100 speed. Using K = 12.5, the relationship between EV at ISO 100 and luminance L is then :
L = 2(EV-3)
The situation with incident-light meters is more complicated than that for reflected-light meters, because the calibration constant C depends on the sensor type. Illuminance is measured with a flat sensor; a typical value for C is 250 with illuminance in lux. Using C = 250, the relationship between EV at ISO 100 and illuminance E is then :
E = 2.5 * 2(EV)
https://nofilmschool.com/2018/03/want-easier-and-faster-way-calculate-exposure-formula
Three basic factors go into the exposure formula itself instead: aperture, shutter, and ISO. Plus a light meter calibration constant.
f-stop²/shutter (in seconds) = lux * ISO/C
If you at least know four of those variables, you’ll be able to calculate the missing value.
So, say you want to figure out how much light you’re going to need in order to shoot at a certain f-stop. Well, all you do is plug in your values (you should know the f-stop, ISO, and your light meter calibration constant) into the formula below:
lux = C (f-stop²/shutter (in seconds))/ISO
Exposure Value Calculator:
https://snapheadshots.com/resources/exposure-and-light-calculator
https://www.scantips.com/lights/exposurecalc.html
https://www.pointsinfocus.com/tools/exposure-settings-ev-calculator/#google_vignette
From that perspective, an exposure stop is a measurement of Exposure and provides a universal linear scale to measure the increase and decrease in light, exposed to the image sensor, due to changes in shutter speed, iso & f-stop.
+-1 stop is a doubling or halving of the amount of light let in when taking a photo.
1 EV is just another way to say one stop of exposure change.One major use of EV (Exposure Value) is just to measure any change of exposure, where one EV implies a change of one stop of exposure. Like when we compensate our picture in the camera.
If the picture comes out too dark, our manual exposure could correct the next one by directly adjusting one of the three exposure controls (f/stop, shutter speed, or ISO). Or if using camera automation, the camera meter is controlling it, but we might apply +1 EV exposure compensation (or +1 EV flash compensation) to make the result goal brighter, as desired. This use of 1 EV is just another way to say one stop of exposure change.
On a perfect day the difference from sampling the sky vs the sun exposure with diffusing spot meters is about 3.2 exposure difference.
 ~15.4 EV for the sun
 ~12.2 EV for the sky
That is as a ballpark. All still influenced by surroundings, accuracy parameters, fov of the sensor…


EV calculator
https://www.scantips.com/lights/evchart.html#calc
http://www.fredparker.com/ultexp1.htm
Exposure value is basically used to indicate an interval on the photographic exposure scale, with a difference of 1 EV corresponding to a standard power-of-2 exposure step, also commonly referred to as a “stop”.
https://contrastly.com/a-guide-to-understanding-exposure-value-ev/
Retrieving photographic exposure from an image
All you can hope to measure with your camera and some images is the relative reflected luminance. Even if you have the camera settings. https://en.wikipedia.org/wiki/Relative_luminance
If you REALLY want to know the amount of light in absolute radiometric units, you’re going to need to use some kind of absolute light meter or measured light source to calibrate your camera. For references on how to do this, see: Section 2.5 Obtaining Absolute Radiance from http://www.pauldebevec.com/Research/HDR/debevec-siggraph97.pdf
IF you are still trying to gauge relative brightness, the level of the sun in Nuke can vary, but it should be in the thousands. Ie: between 30,000 and 65,0000 rgb value depending on time of the day, season and atmospherics.
The values for a 12 o’clock sun, with the sun sampled at EV 15.5 (shutter 1/30, ISO 100, F22) is 32.000 RGB max values (or 32,000 pixel luminance).
The thing to keep an eye for is the level of contrast between sunny side/fill side. The terminator should be quite obvious, there can be up to 3 stops difference between fill/key in sunny lit objects.Note: In Foundry’s Nuke, the software will map 18% gray to whatever your center f/stop is set to in the viewer settings (f/8 by default… change that to EV by following the instructions below).
You can experiment with this by attaching an Exposure node to a Constant set to 0.18, setting your viewer read-out to Spotmeter, and adjusting the stops in the node up and down. You will see that a full stop up or down will give you the respective next value on the aperture scale (f8, f11, f16 etc.).
One stop doubles or halves the amount or light that hits the filmback/ccd, so everything works in powers of 2.
So starting with 0.18 in your constant, you will see that raising it by a stop will give you .36 as a floating point number (in linear space), while your f/stop will be f/11 and so on.If you set your center stop to 0 (see below) you will get a relative readout in EVs, where EV 0 again equals 18% constant gray.
Note: make sure to set your Nuke read node to ‘raw data’
In other words. Setting the center f-stop to 0 means that in a neutral plate, the middle gray in the macbeth chart will equal to exposure value 0. EV 0 corresponds to an exposure time of 1 sec and an aperture of f/1.0.
To switch Foundry’s Nuke’s SpotMeter to return the EV of an image, click on the main viewport, and then press s, this opens the viewer’s properties. Now set the center f-stop to 0 in there. And the SpotMeter in the viewport will change from aperture and fstops to EV.
If you are trying to gauge the EV from the pixel luminance in the image:
– Setting the center f-stop to 0 means that in a neutral plate, the middle 18% gray will equal to exposure value 0.
– So if EV 0 = 0.18 middle gray in nuke which equal to a pixel luminance of 0.18, doubling that value, doubles the EV..18 pixel luminance = 0EV .36 pixel luminance = 1EV .72 pixel luminance = 2EV 1.46 pixel luminance = 3EV ...
This is a Geometric Progression function: xn = ar(n-1)
The most basic example of this function is 1,2,4,8,16,32,… The sequence starts at 1 and doubles each time, so
- a=1 (the first term)
- r=2 (the “common ratio” between terms is a doubling)
And we get:
{a, ar, ar2, ar3, … }
= {1, 1×2, 1×22, 1×23, … }
= {1, 2, 4, 8, … }
In this example the function translates to: n = 2(n-1)
You can graph this curve through this expression: x = 2(y-1) :
You can go back and forth between the two values through a geometric progression function and a log function:
(Note: in a spreadsheet this is: = POWER(2; cell# -1) and =LOG(cell#, 2)+1) )
2(y-1) log2(x)+1 x y 1 1 2 2 4 3 8 4 16 5 32 6 64 7 128 8 256 9 512 10 1024 11 2048 12 4096 13 Translating this into a geometric progression between an image pixel luminance and EV:
-
Photography basics: Lumens vs Candelas (candle) vs Lux vs FootCandle vs Watts vs Irradiance vs Illuminance
Read more: Photography basics: Lumens vs Candelas (candle) vs Lux vs FootCandle vs Watts vs Irradiance vs Illuminancehttps://www.translatorscafe.com/unit-converter/en-US/illumination/1-11/

The power output of a light source is measured using the unit of watts W. This is a direct measure to calculate how much power the light is going to drain from your socket and it is not relatable to the light brightness itself.
The amount of energy emitted from it per second. That energy comes out in a form of photons which we can crudely represent with rays of light coming out of the source. The higher the power the more rays emitted from the source in a unit of time.
Not all energy emitted is visible to the human eye, so we often rely on photometric measurements, which takes in account the sensitivity of human eye to different wavelenghts


Details in the post
(more…) -
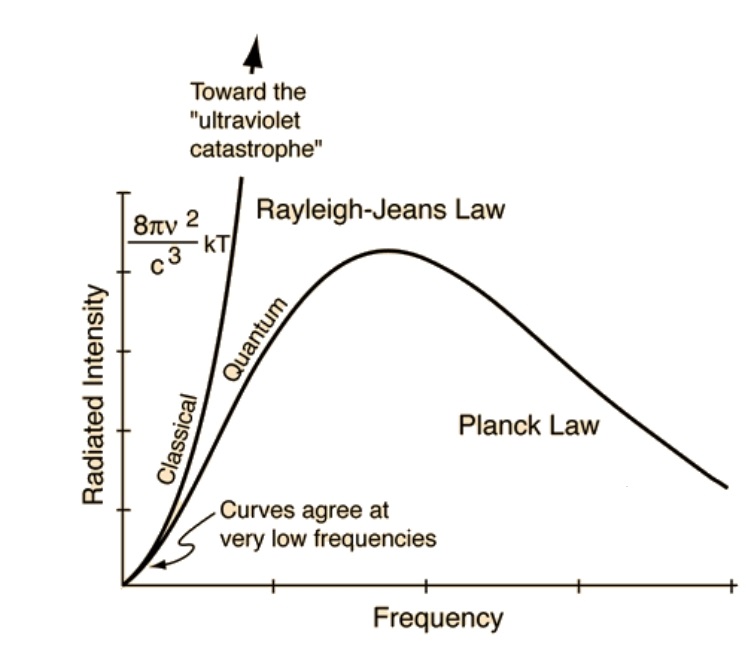
The Color of Infinite Temperature
Read more: The Color of Infinite TemperatureThis is the color of something infinitely hot.

Of course you’d instantly be fried by gamma rays of arbitrarily high frequency, but this would be its spectrum in the visible range.
johncarlosbaez.wordpress.com/2022/01/16/the-color-of-infinite-temperature/
This is also the color of a typical neutron star. They’re so hot they look the same.
It’s also the color of the early Universe!This was worked out by David Madore.
The color he got is sRGB(148,177,255).
www.htmlcsscolor.com/hex/94B1FFAnd according to the experts who sip latte all day and make up names for colors, this color is called ‘Perano’.
-
HDRI Median Cut plugin
Read more: HDRI Median Cut pluginwww.hdrlabs.com/picturenaut/plugins.html

Note. The Median Cut algorithm is typically used for color quantization, which involves reducing the number of colors in an image while preserving its visual quality. It doesn’t directly provide a way to identify the brightest areas in an image. However, if you’re interested in identifying the brightest areas, you might want to look into other methods like thresholding, histogram analysis, or edge detection, through openCV for example.
Here is an openCV example:
# bottom left coordinates = 0,0 import numpy as np import cv2 # Load the HDR or EXR image image = cv2.imread('your_image_path.exr', cv2.IMREAD_UNCHANGED) # Load as-is without modification # Calculate the luminance from the HDR channels (assuming RGB format) luminance = np.dot(image[..., :3], [0.299, 0.587, 0.114]) # Set a threshold value based on estimated EV threshold_value = 2.4 # Estimated threshold value based on 4.8 EV # Apply the threshold to identify bright areas # Theluminancearray contains the calculated luminance values for each pixel in the image. # Thethreshold_valueis a user-defined value that represents a cutoff point, separating "bright" and "dark" areas in terms of perceived luminance.thresholded = (luminance > threshold_value) * 255 # Convert the thresholded image to uint8 for contour detection thresholded = thresholded.astype(np.uint8) # Find contours of the bright areas contours, _ = cv2.findContours(thresholded, cv2.RETR_EXTERNAL, cv2.CHAIN_APPROX_SIMPLE) # Create a list to store the bounding boxes of bright areas bright_areas = [] # Iterate through contours and extract bounding boxes for contour in contours: x, y, w, h = cv2.boundingRect(contour) # Adjust y-coordinate based on bottom-left origin y_bottom_left_origin = image.shape[0] - (y + h) bright_areas.append((x, y_bottom_left_origin, x + w, y_bottom_left_origin + h)) # Store as (x1, y1, x2, y2) # Print the identified bright areas print("Bright Areas (x1, y1, x2, y2):") for area in bright_areas: print(area)More details
Luminance and Exposure in an EXR Image:
- An EXR (Extended Dynamic Range) image format is often used to store high dynamic range (HDR) images that contain a wide range of luminance values, capturing both dark and bright areas.
- Luminance refers to the perceived brightness of a pixel in an image. In an RGB image, luminance is often calculated using a weighted sum of the red, green, and blue channels, where different weights are assigned to each channel to account for human perception.
- In an EXR image, the pixel values can represent radiometrically accurate scene values, including actual radiance or irradiance levels. These values are directly related to the amount of light emitted or reflected by objects in the scene.
The luminance line is calculating the luminance of each pixel in the image using a weighted sum of the red, green, and blue channels. The three float values [0.299, 0.587, 0.114] are the weights used to perform this calculation.
These weights are based on the concept of luminosity, which aims to approximate the perceived brightness of a color by taking into account the human eye’s sensitivity to different colors. The values are often derived from the NTSC (National Television System Committee) standard, which is used in various color image processing operations.
Here’s the breakdown of the float values:
- 0.299: Weight for the red channel.
- 0.587: Weight for the green channel.
- 0.114: Weight for the blue channel.
The weighted sum of these channels helps create a grayscale image where the pixel values represent the perceived brightness. This technique is often used when converting a color image to grayscale or when calculating luminance for certain operations, as it takes into account the human eye’s sensitivity to different colors.
For the threshold, remember that the exact relationship between EV values and pixel values can depend on the tone-mapping or normalization applied to the HDR image, as well as the dynamic range of the image itself.
To establish a relationship between exposure and the threshold value, you can consider the relationship between linear and logarithmic scales:
- Linear and Logarithmic Scales:
- Exposure values in an EXR image are often represented in logarithmic scales, such as EV (exposure value). Each increment in EV represents a doubling or halving of the amount of light captured.
- Threshold values for luminance thresholding are usually linear, representing an actual luminance level.
- Conversion Between Scales:
- To establish a mathematical relationship, you need to convert between the logarithmic exposure scale and the linear threshold scale.
- One common method is to use a power function. For instance, you can use a power function to convert EV to a linear intensity value.
threshold_value = base_value * (2 ** EV)Here,
EVis the exposure value,base_valueis a scaling factor that determines the relationship between EV and threshold_value, and2 ** EVis used to convert the logarithmic EV to a linear intensity value. - Choosing the Base Value:
- The
base_valuefactor should be determined based on the dynamic range of your EXR image and the specific luminance values you are dealing with. - You may need to experiment with different values of
base_valueto achieve the desired separation of bright areas from the rest of the image.
- The
Let’s say you have an EXR image with a dynamic range of 12 EV, which is a common range for many high dynamic range images. In this case, you want to set a threshold value that corresponds to a certain number of EV above the middle gray level (which is often considered to be around 0.18).
Here’s an example of how you might determine a
base_valueto achieve this:# Define the dynamic range of the image in EV dynamic_range = 12 # Choose the desired number of EV above middle gray for thresholding desired_ev_above_middle_gray = 2 # Calculate the threshold value based on the desired EV above middle gray threshold_value = 0.18 * (2 ** (desired_ev_above_middle_gray / dynamic_range)) print("Threshold Value:", threshold_value) -
LUX vs LUMEN vs NITS vs CANDELA – What is the difference
Read more: LUX vs LUMEN vs NITS vs CANDELA – What is the differenceMore details here: Lumens vs Candelas (candle) vs Lux vs FootCandle vs Watts vs Irradiance vs Illuminance


https://www.inhouseav.com.au/blog/beginners-guide-nits-lumens-brightness/

Candela
Candela is the basic unit of measure of the entire volume of light intensity from any point in a single direction from a light source. Note the detail: it measures the total volume of light within a certain beam angle and direction.
While the luminance of starlight is around 0.001 cd/m2, that of a sunlit scene is around 100,000 cd/m2, which is a hundred millions times higher. The luminance of the sun itself is approximately 1,000,000,000 cd/m2.NIT
https://en.wikipedia.org/wiki/Candela_per_square_metre
The candela per square metre (symbol: cd/m2) is the unit of luminance in the International System of Units (SI). The unit is based on the candela, the SI unit of luminous intensity, and the square metre, the SI unit of area. The nit (symbol: nt) is a non-SI name also used for this unit (1 nt = 1 cd/m2).[1] The term nit is believed to come from the Latin word nitēre, “to shine”. As a measure of light emitted per unit area, this unit is frequently used to specify the brightness of a display device.
NIT and cd/m2 (candela power) represent the same thing and can be used interchangeably. One nit is equivalent to one candela per square meter, where the candela is the amount of light which has been emitted by a common tallow candle, but NIT is not part of the International System of Units (abbreviated SI, from Systeme International, in French).
It’s easiest to think of a TV as emitting light directly, in much the same way as the Sun does. Nits are simply the measurement of the level of light (luminance) in a given area which the emitting source sends to your eyes or a camera sensor.
The Nit can be considered a unit of visible-light intensity which is often used to specify the brightness level of an LCD.
1 Nit is approximately equal to 3.426 Lumens. To work out a comparable number of Nits to Lumens, you need to multiply the number of Nits by 3.426. If you know the number of Lumens, and wish to know the Nits, simply divide the number of Lumens by 3.426.
Most consumer desktop LCDs have Nits of 200 to 300, the average TV most likely has an output capability of between 100 and 200 Nits, and an HDR TV ranges from 400 to 1,500 Nits.
Virtual Production sets currently sport around 6000 NIT ceiling and 1000 NIT wall panels.The ambient brightness of a sunny day with clear blue skies is between 7000-10,000 nits (between 3000-7000 nits for overcast skies and indirect sunlight).
A bright sunny day can have specular highlights that reach over 100,000 nits. Direct sunlight is around 1,600,000,000 nits.
10,000 nits is also the typical brightness of a fluorescent tube – bright, but not painful to look at.
https://www.displaydaily.com/article/display-daily/dolby-vision-vs-hdr10-clarified
Tests showed that a “black level” of 0.005 nits (cd/m²) satisfied the vast majority of viewers. While 0.005 nits is very close to true black, Griffis says Dolby can go down to a black of 0.0001 nits, even though there is no need or ability for displays to get that dark today.
How bright is white? Dolby says the range of 0.005 nits – 10,000 nits satisfied 84% of the viewers in their viewing tests.
The brightest consumer HDR displays today are about 1,500 nits. Professional displays where HDR content is color-graded can achieve up to 4,000 nits peak brightness.High brightness that would be in danger of damaging the eye would be in the neighborhood of 250,000 nits.
Lumens
Lumen is a measure of how much light is emitted (luminance, luminous flux) by an object. It indicates the total potential amount of light from a light source that is visible to the human eye.
Lumen is commonly used in the context of light bulbs or video-projectors as a metric for their brightness power.Lumen is used to describe light output, and about video projectors, it is commonly referred to as ANSI Lumens. Simply put, lumens is how to find out how bright a LED display is. The higher the lumens, the brighter to display!
Technically speaking, a Lumen is the SI unit of luminous flux, which is equal to the amount of light which is emitted per second in a unit solid angle of one steradian from a uniform source of one-candela intensity radiating in all directions.
LUX
Lux (lx) or often Illuminance, is a photometric unit along a given area, which takes in account the sensitivity of human eye to different wavelenghts. It is the measure of light at a specific distance within a specific area at that distance. Often used to measure the incidental sun’s intensity.


COLLECTIONS
| Featured AI
| Design And Composition
| Explore posts
POPULAR SEARCHES
unreal | pipeline | virtual production | free | learn | photoshop | 360 | macro | google | nvidia | resolution | open source | hdri | real-time | photography basics | nuke
FEATURED POSTS
Social Links
DISCLAIMER – Links and images on this website may be protected by the respective owners’ copyright. All data submitted by users through this site shall be treated as freely available to share.
