


COMPOSITION
-
Key/Fill ratios and scene composition using false colors
Read more: Key/Fill ratios and scene composition using false colors

To measure the contrast ratio you will need a light meter. The process starts with you measuring the main source of light, or the key light.
Get a reading from the brightest area on the face of your subject. Then, measure the area lit by the secondary light, or fill light. To make sense of what you have just measured you have to understand that the information you have just gathered is in F-stops, a measure of light. With each additional F-stop, for example going one stop from f/1.4 to f/2.0, you create a doubling of light. The reverse is also true; moving one stop from f/8.0 to f/5.6 results in a halving of the light.
Let’s say you grabbed a measurement from your key light of f/8.0. Then, when you measured your fill light area, you get a reading of f/4.0. This will lead you to a contrast ratio of 4:1 because there are two stops between f/4.0 and f/8.0 and each stop doubles the amount of light. In other words, two stops x twice the light per stop = four times as much light at f/8.0 than at f/4.0.

theslantedlens.com/2017/lighting-ratios-photo-video/
Examples in the post
-
HuggingFace ai-comic-factory – a FREE AI Comic Book Creator
Read more: HuggingFace ai-comic-factory – a FREE AI Comic Book Creatorhttps://huggingface.co/spaces/jbilcke-hf/ai-comic-factory

this is the epic story of a group of talented digital artists trying to overcame daily technical challenges to achieve incredibly photorealistic projects of monsters and aliens


DESIGN


COLOR
-
Björn Ottosson – How software gets color wrong
Read more: Björn Ottosson – How software gets color wronghttps://bottosson.github.io/posts/colorwrong/
Most software around us today are decent at accurately displaying colors. Processing of colors is another story unfortunately, and is often done badly.
To understand what the problem is, let’s start with an example of three ways of blending green and magenta:
- Perceptual blend – A smooth transition using a model designed to mimic human perception of color. The blending is done so that the perceived brightness and color varies smoothly and evenly.
- Linear blend – A model for blending color based on how light behaves physically. This type of blending can occur in many ways naturally, for example when colors are blended together by focus blur in a camera or when viewing a pattern of two colors at a distance.
- sRGB blend – This is how colors would normally be blended in computer software, using sRGB to represent the colors.

Let’s look at some more examples of blending of colors, to see how these problems surface more practically. The examples use strong colors since then the differences are more pronounced. This is using the same three ways of blending colors as the first example.

Instead of making it as easy as possible to work with color, most software make it unnecessarily hard, by doing image processing with representations not designed for it. Approximating the physical behavior of light with linear RGB models is one easy thing to do, but more work is needed to create image representations tailored for image processing and human perception.
Also see:
-
No one could see the colour blue until modern times
Read more: No one could see the colour blue until modern timeshttps://www.businessinsider.com/what-is-blue-and-how-do-we-see-color-2015-2

The way that humans see the world… until we have a way to describe something, even something so fundamental as a colour, we may not even notice that something it’s there.
Ancient languages didn’t have a word for blue — not Greek, not Chinese, not Japanese, not Hebrew, not Icelandic cultures. And without a word for the colour, there’s evidence that they may not have seen it at all.
https://www.wnycstudios.org/story/211119-colors
Every language first had a word for black and for white, or dark and light. The next word for a colour to come into existence — in every language studied around the world — was red, the colour of blood and wine.
After red, historically, yellow appears, and later, green (though in a couple of languages, yellow and green switch places). The last of these colours to appear in every language is blue.
The only ancient culture to develop a word for blue was the Egyptians — and as it happens, they were also the only culture that had a way to produce a blue dye.
https://mymodernmet.com/shades-of-blue-color-history/
Considered to be the first ever synthetically produced color pigment, Egyptian blue (also known as cuprorivaite) was created around 2,200 B.C. It was made from ground limestone mixed with sand and a copper-containing mineral, such as azurite or malachite, which was then heated between 1470 and 1650°F. The result was an opaque blue glass which then had to be crushed and combined with thickening agents such as egg whites to create a long-lasting paint or glaze.
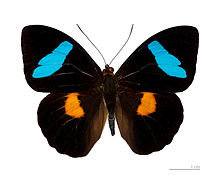
If you think about it, blue doesn’t appear much in nature — there aren’t animals with blue pigments (except for one butterfly, Obrina Olivewing, all animals generate blue through light scattering), blue eyes are rare (also blue through light scattering), and blue flowers are mostly human creations. There is, of course, the sky, but is that really blue?

So before we had a word for it, did people not naturally see blue? Do you really see something if you don’t have a word for it?
A researcher named Jules Davidoff traveled to Namibia to investigate this, where he conducted an experiment with the Himba tribe, who speak a language that has no word for blue or distinction between blue and green. When shown a circle with 11 green squares and one blue, they couldn’t pick out which one was different from the others.
When looking at a circle of green squares with only one slightly different shade, they could immediately spot the different one. Can you?
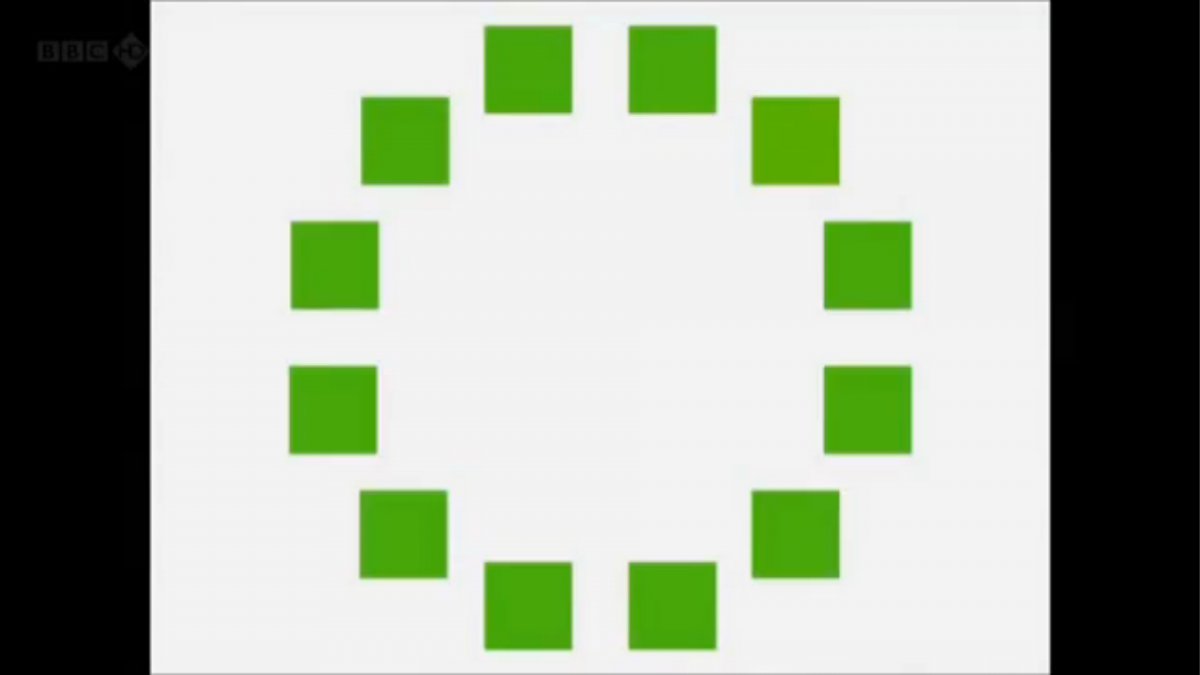
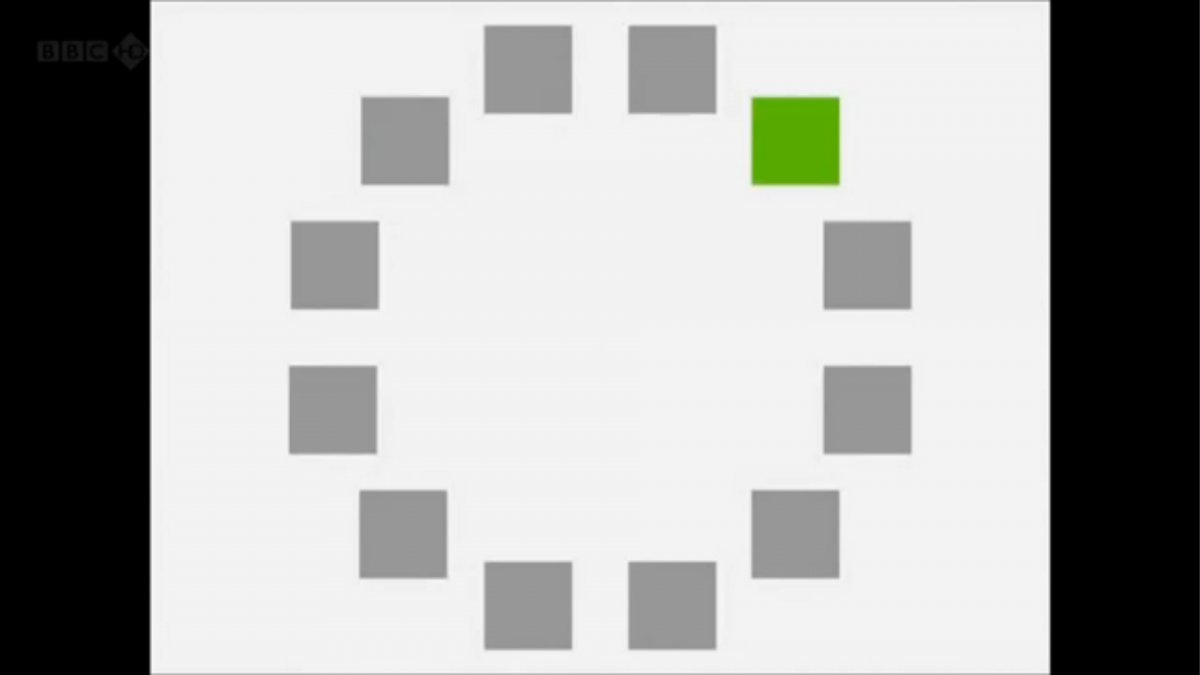
Davidoff says that without a word for a colour, without a way of identifying it as different, it’s much harder for us to notice what’s unique about it — even though our eyes are physically seeing the blocks it in the same way.
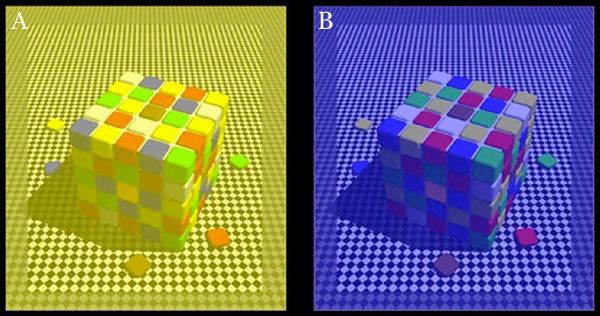
Further research brought to wider discussions about color perception in humans. Everything that we make is based on the fact that humans are trichromatic. The television only has 3 colors. Our color printers have 3 different colors. But some people, and in specific some women seemed to be more sensible to color differences… mainly because they’re just more aware or – because of the job that they do.
Eventually this brought to the discovery of a small percentage of the population, referred to as tetrachromats, which developed an extra cone sensitivity to yellow, likely due to gene modifications.
The interesting detail about these is that even between tetrachromats, only the ones that had a reason to develop, label and work with extra color sensitivity actually developed the ability to use their native skills.
So before blue became a common concept, maybe humans saw it. But it seems they didn’t know they were seeing it.
If you see something yet can’t see it, does it exist? Did colours come into existence over time? Not technically, but our ability to notice them… may have…
-
Sensitivity of human eye
Read more: Sensitivity of human eyehttp://www.wikilectures.eu/index.php/Spectral_sensitivity_of_the_human_eye
http://www.normankoren.com/Human_spectral_sensitivity_small.jpg
Spectral sensitivity of eye is influenced by light intensity. And the light intensity determines the level of activity of cones cell and rod cell. This is the main characteristic of human vision. Sensitivity to individual colors, in other words, wavelengths of the light spectrum, is explained by the RGB (red-green-blue) theory. This theory assumed that there are three kinds of cones. It’s selectively sensitive to red (700-630 nm), green (560-500 nm), and blue (490-450 nm) light. And their mutual interaction allow to perceive all colors of the spectrum.
http://weeklysciencequiz.blogspot.com/2013/01/violet-skies-are-for-birds.html

Sensitivity of human eye Sensitivity of human eyes to light increase with the decrease in light intensity. In day-light condition, the cones cell is responding to this condition. And the eye is most sensitive at 555 nm. In darkness condition, the rod cell is responding to this condition. And the eye is most sensitive at 507 nm.
As light intensity decreases, cone function changes more effective way. And when decrease the light intensity, it prompt to accumulation of rhodopsin. Furthermore, in activates rods, it allow to respond to stimuli of light in much lower intensity.

The three curves in the figure above shows the normalized response of an average human eye to various amounts of ambient light. The shift in sensitivity occurs because two types of photoreceptors called cones and rods are responsible for the eye’s response to light. The curve on the right shows the eye’s response under normal lighting conditions and this is called the photopic response. The cones respond to light under these conditions.
As mentioned previously, cones are composed of three different photo pigments that enable color perception. This curve peaks at 555 nanometers, which means that under normal lighting conditions, the eye is most sensitive to a yellowish-green color. When the light levels drop to near total darkness, the response of the eye changes significantly as shown by the scotopic response curve on the left. At this level of light, the rods are most active and the human eye is more sensitive to the light present, and less sensitive to the range of color. Rods are highly sensitive to light but are comprised of a single photo pigment, which accounts for the loss in ability to discriminate color. At this very low light level, sensitivity to blue, violet, and ultraviolet is increased, but sensitivity to yellow and red is reduced. The heavier curve in the middle represents the eye’s response at the ambient light level found in a typical inspection booth. This curve peaks at 550 nanometers, which means the eye is most sensitive to yellowish-green color at this light level. Fluorescent penetrant inspection materials are designed to fluoresce at around 550 nanometers to produce optimal sensitivity under dim lighting conditions.


![[gamma correction test]](http://www.madore.org/~david/misc/color/gammatest.png "sRGB gamma correction test")

LIGHTING
-
HDRI Median Cut plugin
Read more: HDRI Median Cut pluginwww.hdrlabs.com/picturenaut/plugins.html

Note. The Median Cut algorithm is typically used for color quantization, which involves reducing the number of colors in an image while preserving its visual quality. It doesn’t directly provide a way to identify the brightest areas in an image. However, if you’re interested in identifying the brightest areas, you might want to look into other methods like thresholding, histogram analysis, or edge detection, through openCV for example.
Here is an openCV example:
# bottom left coordinates = 0,0 import numpy as np import cv2 # Load the HDR or EXR image image = cv2.imread('your_image_path.exr', cv2.IMREAD_UNCHANGED) # Load as-is without modification # Calculate the luminance from the HDR channels (assuming RGB format) luminance = np.dot(image[..., :3], [0.299, 0.587, 0.114]) # Set a threshold value based on estimated EV threshold_value = 2.4 # Estimated threshold value based on 4.8 EV # Apply the threshold to identify bright areas # Theluminancearray contains the calculated luminance values for each pixel in the image. # Thethreshold_valueis a user-defined value that represents a cutoff point, separating "bright" and "dark" areas in terms of perceived luminance.thresholded = (luminance > threshold_value) * 255 # Convert the thresholded image to uint8 for contour detection thresholded = thresholded.astype(np.uint8) # Find contours of the bright areas contours, _ = cv2.findContours(thresholded, cv2.RETR_EXTERNAL, cv2.CHAIN_APPROX_SIMPLE) # Create a list to store the bounding boxes of bright areas bright_areas = [] # Iterate through contours and extract bounding boxes for contour in contours: x, y, w, h = cv2.boundingRect(contour) # Adjust y-coordinate based on bottom-left origin y_bottom_left_origin = image.shape[0] - (y + h) bright_areas.append((x, y_bottom_left_origin, x + w, y_bottom_left_origin + h)) # Store as (x1, y1, x2, y2) # Print the identified bright areas print("Bright Areas (x1, y1, x2, y2):") for area in bright_areas: print(area)More details
Luminance and Exposure in an EXR Image:
- An EXR (Extended Dynamic Range) image format is often used to store high dynamic range (HDR) images that contain a wide range of luminance values, capturing both dark and bright areas.
- Luminance refers to the perceived brightness of a pixel in an image. In an RGB image, luminance is often calculated using a weighted sum of the red, green, and blue channels, where different weights are assigned to each channel to account for human perception.
- In an EXR image, the pixel values can represent radiometrically accurate scene values, including actual radiance or irradiance levels. These values are directly related to the amount of light emitted or reflected by objects in the scene.
The luminance line is calculating the luminance of each pixel in the image using a weighted sum of the red, green, and blue channels. The three float values [0.299, 0.587, 0.114] are the weights used to perform this calculation.
These weights are based on the concept of luminosity, which aims to approximate the perceived brightness of a color by taking into account the human eye’s sensitivity to different colors. The values are often derived from the NTSC (National Television System Committee) standard, which is used in various color image processing operations.
Here’s the breakdown of the float values:
- 0.299: Weight for the red channel.
- 0.587: Weight for the green channel.
- 0.114: Weight for the blue channel.
The weighted sum of these channels helps create a grayscale image where the pixel values represent the perceived brightness. This technique is often used when converting a color image to grayscale or when calculating luminance for certain operations, as it takes into account the human eye’s sensitivity to different colors.
For the threshold, remember that the exact relationship between EV values and pixel values can depend on the tone-mapping or normalization applied to the HDR image, as well as the dynamic range of the image itself.
To establish a relationship between exposure and the threshold value, you can consider the relationship between linear and logarithmic scales:
- Linear and Logarithmic Scales:
- Exposure values in an EXR image are often represented in logarithmic scales, such as EV (exposure value). Each increment in EV represents a doubling or halving of the amount of light captured.
- Threshold values for luminance thresholding are usually linear, representing an actual luminance level.
- Conversion Between Scales:
- To establish a mathematical relationship, you need to convert between the logarithmic exposure scale and the linear threshold scale.
- One common method is to use a power function. For instance, you can use a power function to convert EV to a linear intensity value.
threshold_value = base_value * (2 ** EV)Here,
EVis the exposure value,base_valueis a scaling factor that determines the relationship between EV and threshold_value, and2 ** EVis used to convert the logarithmic EV to a linear intensity value. - Choosing the Base Value:
- The
base_valuefactor should be determined based on the dynamic range of your EXR image and the specific luminance values you are dealing with. - You may need to experiment with different values of
base_valueto achieve the desired separation of bright areas from the rest of the image.
- The
Let’s say you have an EXR image with a dynamic range of 12 EV, which is a common range for many high dynamic range images. In this case, you want to set a threshold value that corresponds to a certain number of EV above the middle gray level (which is often considered to be around 0.18).
Here’s an example of how you might determine a
base_valueto achieve this:# Define the dynamic range of the image in EV dynamic_range = 12 # Choose the desired number of EV above middle gray for thresholding desired_ev_above_middle_gray = 2 # Calculate the threshold value based on the desired EV above middle gray threshold_value = 0.18 * (2 ** (desired_ev_above_middle_gray / dynamic_range)) print("Threshold Value:", threshold_value) -
Light and Matter : The 2018 theory of Physically-Based Rendering and Shading by Allegorithmic
Read more: Light and Matter : The 2018 theory of Physically-Based Rendering and Shading by Allegorithmicacademy.substance3d.com/courses/the-pbr-guide-part-1
academy.substance3d.com/courses/the-pbr-guide-part-2

 Local copy:
-
Cinematographers Blueprint 300dpi poster
Read more: Cinematographers Blueprint 300dpi posterThe 300dpi digital poster is now available to all PixelSham.com subscribers.

If you have already subscribed and wish a copy, please send me a note through the contact page.


COLLECTIONS
| Featured AI
| Design And Composition
| Explore posts
POPULAR SEARCHES
unreal | pipeline | virtual production | free | learn | photoshop | 360 | macro | google | nvidia | resolution | open source | hdri | real-time | photography basics | nuke
FEATURED POSTS
-
UV maps
-
Types of AI Explained in a few Minutes – AI Glossary
-
AnimationXpress.com interviews Daniele Tosti for TheCgCareer.com channel
-
Photography basics: Color Temperature and White Balance
-
STOP FCC – SAVE THE FREE NET
-
59 AI Filmmaking Tools For Your Workflow
-
Eddie Yoon – There’s a big misconception about AI creative
-
Principles of Animation with Alan Becker, Dermot OConnor and Shaun Keenan
Social Links
DISCLAIMER – Links and images on this website may be protected by the respective owners’ copyright. All data submitted by users through this site shall be treated as freely available to share.
