


COMPOSITION


DESIGN
-
Turn Yourself Into an Action Figure Using ChatGPT
Read more: Turn Yourself Into an Action Figure Using ChatGPT
ChatGPT Action Figure Prompts:
Create an action figure from the photo. It must be visualised in a realistic way. There should be accessories next to the figure like a UX designer have, Macbook Pro, a camera, drawing tablet, headset etc. Add a hole to the top of the box in the action figure. Also write the text “UX Mate” and below it “Keep Learning! Keep Designing
Use this image to create a picture of a action figure toy of a construction worker in a blister package from head to toe with accessories including a hammer, a staple gun and a ladder. The package should read “Kirk The Handy Man”
Create a realistic image of a toy action figure box. The box should be designed in a toy-equipment/action-figure style, with a cut-out window at the top like classic action figure packaging. The main color of the box and moleskine notebook should match the color of my jacket (referenced visually). Add colorful Mexican skull decorations across the box for a vibrant and artistic flair. Inside the box, include a “Your name” action figure, posed heroically. Next to the figure, arrange the following “equipment” in a stylized layout: • item 1 • item 2 … On the box, write: “Your name” (bold title font) Underneath: “Your role or anything else” The entire scene should look like a real product mockup, highly realistic, lit like a studio product photo. On the box, write: “Your name” (bold title font) Underneath: “Your role or description” The entire scene should look like a real product mockup, highly realistic, lit like a studio product photo. Prompt on Kling AI The figure steps out of its toy packaging and begins walking forward. As he continues to walk, the camera gradually zooms out in sync with his movement.
“Create image. Create a toy of the person in the photo. Let it be an action figure. Next to the figure, there should be the toy’s equipment, each in its individual blisters. 1) a book called “Tecnoforma”. 2) A 3-headed dog with a tag that says “Troika” and a bone at its feet with word “austerity” written on it. 3) a three-headed Hydra with with a tag called “Geringonça”. 4) a book titled “D. Sebastião”. Don’t repeat the equipment under any circumstance. The card holding the blister should be strong orange. Also, on top of the box, write ‘Pedro Passos Coelho’ and underneath it, ‘PSD action figure’. The figure and equipment must all be inside blisters. Visualize this in a realistic way.”


-
Interactive Maps of Earthquakes around the world
Read more: Interactive Maps of Earthquakes around the worldhttps://ralucanicola.github.io/JSAPI_demos/earthquakes
https://ralucanicola.github.io/JSAPI_demos/earthquakes-depth
https://ralucanicola.github.io/JSAPI_demos/ridgecrest-earthquake
https://ralucanicola.github.io/JSAPI_demos/last-earthquakes


COLOR
-
Björn Ottosson – How software gets color wrong
Read more: Björn Ottosson – How software gets color wronghttps://bottosson.github.io/posts/colorwrong/
Most software around us today are decent at accurately displaying colors. Processing of colors is another story unfortunately, and is often done badly.
To understand what the problem is, let’s start with an example of three ways of blending green and magenta:
- Perceptual blend – A smooth transition using a model designed to mimic human perception of color. The blending is done so that the perceived brightness and color varies smoothly and evenly.
- Linear blend – A model for blending color based on how light behaves physically. This type of blending can occur in many ways naturally, for example when colors are blended together by focus blur in a camera or when viewing a pattern of two colors at a distance.
- sRGB blend – This is how colors would normally be blended in computer software, using sRGB to represent the colors.

Let’s look at some more examples of blending of colors, to see how these problems surface more practically. The examples use strong colors since then the differences are more pronounced. This is using the same three ways of blending colors as the first example.

Instead of making it as easy as possible to work with color, most software make it unnecessarily hard, by doing image processing with representations not designed for it. Approximating the physical behavior of light with linear RGB models is one easy thing to do, but more work is needed to create image representations tailored for image processing and human perception.
Also see:
-
colorhunt.co
Read more: colorhunt.coColor Hunt is a free and open platform for color inspiration with thousands of trendy hand-picked color palettes.

-
Brett Jones / Phil Reyneri (Lightform) / Philipp7pc: The study of Projection Mapping through Projectors
Read more: Brett Jones / Phil Reyneri (Lightform) / Philipp7pc: The study of Projection Mapping through Projectors


Video Projection Tool Software
https://hcgilje.wordpress.com/vpt/
https://www.projectorpoint.co.uk/news/how-bright-should-my-projector-be/
http://www.adwindowscreens.com/the_calculator/
heavym
https://heavym.net/en/
MadMapper
https://madmapper.com/
-
OLED vs QLED – What TV is better?
Read more: OLED vs QLED – What TV is better?
Supported by LG, Philips, Panasonic and Sony sell the OLED system TVs.
OLED stands for “organic light emitting diode.”
It is a fundamentally different technology from LCD, the major type of TV today.
OLED is “emissive,” meaning the pixels emit their own light.Samsung is branding its best TVs with a new acronym: “QLED”
QLED (according to Samsung) stands for “quantum dot LED TV.”
It is a variation of the common LED LCD, adding a quantum dot film to the LCD “sandwich.”
QLED, like LCD, is, in its current form, “transmissive” and relies on an LED backlight.OLED is the only technology capable of absolute blacks and extremely bright whites on a per-pixel basis. LCD definitely can’t do that, and even the vaunted, beloved, dearly departed plasma couldn’t do absolute blacks.
QLED, as an improvement over OLED, significantly improves the picture quality. QLED can produce an even wider range of colors than OLED, which says something about this new tech. QLED is also known to produce up to 40% higher luminance efficiency than OLED technology. Further, many tests conclude that QLED is far more efficient in terms of power consumption than its predecessor, OLED.

When analyzing TVs color, it may be beneficial to consider at least 3 elements:
“Color Depth”, “Color Gamut”, and “Dynamic Range”.Color Depth (or “Bit-Depth”, e.g. 8-bit, 10-bit, 12-bit) determines how many distinct color variations (tones/shades) can be viewed on a given display.
Color Gamut (e.g. WCG) determines which specific colors can be displayed from a given “Color Space” (Rec.709, Rec.2020, DCI-P3) (i.e. the color range).
Dynamic Range (SDR, HDR) determines the luminosity range of a specific color – from its darkest shade (or tone) to its brightest.
The overall brightness range of a color will be determined by a display’s “contrast ratio”, that is, the ratio of luminance between the darkest black that can be produced and the brightest white.
Color Volume is the “Color Gamut” + the “Dynamic/Luminosity Range”.
A TV’s Color Volume will not only determine which specific colors can be displayed (the color range) but also that color’s luminosity range, which will have an affect on its “brightness”, and “colorfulness” (intensity and saturation).The better the colour volume in a TV, the closer to life the colours appear.
QLED TV can express nearly all of the colours in the DCI-P3 colour space, and of those colours, express 100% of the colour volume, thereby producing an incredible range of colours.
With OLED TV, when the image is too bright, the percentage of the colours in the colour volume produced by the TV drops significantly. The colours get washed out and can only express around 70% colour volume, making the picture quality drop too.
Note. OLED TV uses organic material, so it may lose colour expression as it ages.
Resources for more reading and comparison below
www.avsforum.com/forum/166-lcd-flat-panel-displays/2812161-what-color-volume.html
www.newtechnologytv.com/qled-vs-oled/
news.samsung.com/za/qled-tv-vs-oled-tv
www.cnet.com/news/qled-vs-oled-samsungs-tv-tech-and-lgs-tv-tech-are-not-the-same/

-
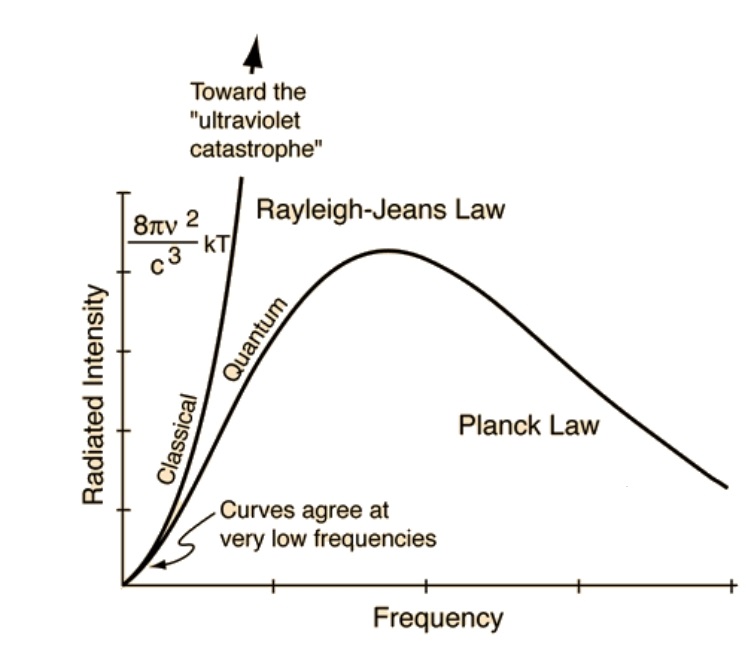
The Color of Infinite Temperature
Read more: The Color of Infinite TemperatureThis is the color of something infinitely hot.

Of course you’d instantly be fried by gamma rays of arbitrarily high frequency, but this would be its spectrum in the visible range.
johncarlosbaez.wordpress.com/2022/01/16/the-color-of-infinite-temperature/
This is also the color of a typical neutron star. They’re so hot they look the same.
It’s also the color of the early Universe!This was worked out by David Madore.
The color he got is sRGB(148,177,255).
www.htmlcsscolor.com/hex/94B1FFAnd according to the experts who sip latte all day and make up names for colors, this color is called ‘Perano’.
-
Björn Ottosson – OKlch color space
Read more: Björn Ottosson – OKlch color spaceBjörn Ottosson proposed OKlch in 2020 to create a color space that can closely mimic how color is perceived by the human eye, predicting perceived lightness, chroma, and hue.
The OK in OKLCH stands for Optimal Color.
- L: Lightness (the perceived brightness of the color)
- C: Chroma (the intensity or saturation of the color)
- H: Hue (the actual color, such as red, blue, green, etc.)

Also read:


LIGHTING
-
Photography basics: Exposure Value vs Photographic Exposure vs Il/Luminance vs Pixel luminance measurements
Read more: Photography basics: Exposure Value vs Photographic Exposure vs Il/Luminance vs Pixel luminance measurementsAlso see: https://www.pixelsham.com/2015/05/16/how-aperture-shutter-speed-and-iso-affect-your-photos/
In photography, exposure value (EV) is a number that represents a combination of a camera’s shutter speed and f-number, such that all combinations that yield the same exposure have the same EV (for any fixed scene luminance).

The EV concept was developed in an attempt to simplify choosing among combinations of equivalent camera settings. Although all camera settings with the same EV nominally give the same exposure, they do not necessarily give the same picture. EV is also used to indicate an interval on the photographic exposure scale. 1 EV corresponding to a standard power-of-2 exposure step, commonly referred to as a stop
EV 0 corresponds to an exposure time of 1 sec and a relative aperture of f/1.0. If the EV is known, it can be used to select combinations of exposure time and f-number.
Note EV does not equal to photographic exposure. Photographic Exposure is defined as how much light hits the camera’s sensor. It depends on the camera settings mainly aperture and shutter speed. Exposure value (known as EV) is a number that represents the exposure setting of the camera.
Thus, strictly, EV is not a measure of luminance (indirect or reflected exposure) or illuminance (incidental exposure); rather, an EV corresponds to a luminance (or illuminance) for which a camera with a given ISO speed would use the indicated EV to obtain the nominally correct exposure. Nonetheless, it is common practice among photographic equipment manufacturers to express luminance in EV for ISO 100 speed, as when specifying metering range or autofocus sensitivity.
The exposure depends on two things: how much light gets through the lenses to the camera’s sensor and for how long the sensor is exposed. The former is a function of the aperture value while the latter is a function of the shutter speed. Exposure value is a number that represents this potential amount of light that could hit the sensor. It is important to understand that exposure value is a measure of how exposed the sensor is to light and not a measure of how much light actually hits the sensor. The exposure value is independent of how lit the scene is. For example a pair of aperture value and shutter speed represents the same exposure value both if the camera is used during a very bright day or during a dark night.
Each exposure value number represents all the possible shutter and aperture settings that result in the same exposure. Although the exposure value is the same for different combinations of aperture values and shutter speeds the resulting photo can be very different (the aperture controls the depth of field while shutter speed controls how much motion is captured).
EV 0.0 is defined as the exposure when setting the aperture to f-number 1.0 and the shutter speed to 1 second. All other exposure values are relative to that number. Exposure values are on a base two logarithmic scale. This means that every single step of EV – plus or minus 1 – represents the exposure (actual light that hits the sensor) being halved or doubled.
https://www.streetdirectory.com/travel_guide/141307/photography/exposure_value_ev_and_exposure_compensation.html
Formula
https://en.wikipedia.org/wiki/Exposure_value
https://www.scantips.com/lights/math.html

which means 2EV = N² / t
where
- N is the relative aperture (f-number) Important: Note that f/stop values must first be squared in most calculations
- t is the exposure time (shutter speed) in seconds
EV 0 corresponds to an exposure time of 1 sec and an aperture of f/1.0.
Example: If f/16 and 1/4 second, then this is:
(N² / t) = (16 × 16 ÷ 1/4) = (16 × 16 × 4) = 1024.
Log₂(1024) is EV 10. Meaning, 210 = 1024.
Collecting photographic exposure using Light Meters
The exposure meter in the camera does not know whether the subject itself is bright or not. It simply measures the amount of light that comes in, and makes a guess based on that. The camera will aim for 18% gray, meaning if you take a photo of an entirely white surface, and an entirely black surface you should get two identical images which both are gray (at least in theory)
https://en.wikipedia.org/wiki/Light_meter
For reflected-light meters, camera settings are related to ISO speed and subject luminance by the reflected-light exposure equation:

where
- N is the relative aperture (f-number)
- t is the exposure time (“shutter speed”) in seconds
- L is the average scene luminance
- S is the ISO arithmetic speed
- K is the reflected-light meter calibration constant
For incident-light meters, camera settings are related to ISO speed and subject illuminance by the incident-light exposure equation:

where
- E is the illuminance (in lux)
- C is the incident-light meter calibration constant
Two values for K are in common use: 12.5 (Canon, Nikon, and Sekonic) and 14 (Minolta, Kenko, and Pentax); the difference between the two values is approximately 1/6 EV.
For C a value of 250 is commonly used.Nonetheless, it is common practice among photographic equipment manufacturers to also express luminance in EV for ISO 100 speed. Using K = 12.5, the relationship between EV at ISO 100 and luminance L is then :
L = 2(EV-3)
The situation with incident-light meters is more complicated than that for reflected-light meters, because the calibration constant C depends on the sensor type. Illuminance is measured with a flat sensor; a typical value for C is 250 with illuminance in lux. Using C = 250, the relationship between EV at ISO 100 and illuminance E is then :
E = 2.5 * 2(EV)
https://nofilmschool.com/2018/03/want-easier-and-faster-way-calculate-exposure-formula
Three basic factors go into the exposure formula itself instead: aperture, shutter, and ISO. Plus a light meter calibration constant.
f-stop²/shutter (in seconds) = lux * ISO/C
If you at least know four of those variables, you’ll be able to calculate the missing value.
So, say you want to figure out how much light you’re going to need in order to shoot at a certain f-stop. Well, all you do is plug in your values (you should know the f-stop, ISO, and your light meter calibration constant) into the formula below:
lux = C (f-stop²/shutter (in seconds))/ISO
Exposure Value Calculator:
https://snapheadshots.com/resources/exposure-and-light-calculator
https://www.scantips.com/lights/exposurecalc.html
https://www.pointsinfocus.com/tools/exposure-settings-ev-calculator/#google_vignette
From that perspective, an exposure stop is a measurement of Exposure and provides a universal linear scale to measure the increase and decrease in light, exposed to the image sensor, due to changes in shutter speed, iso & f-stop.
+-1 stop is a doubling or halving of the amount of light let in when taking a photo.
1 EV is just another way to say one stop of exposure change.One major use of EV (Exposure Value) is just to measure any change of exposure, where one EV implies a change of one stop of exposure. Like when we compensate our picture in the camera.
If the picture comes out too dark, our manual exposure could correct the next one by directly adjusting one of the three exposure controls (f/stop, shutter speed, or ISO). Or if using camera automation, the camera meter is controlling it, but we might apply +1 EV exposure compensation (or +1 EV flash compensation) to make the result goal brighter, as desired. This use of 1 EV is just another way to say one stop of exposure change.
On a perfect day the difference from sampling the sky vs the sun exposure with diffusing spot meters is about 3.2 exposure difference.
 ~15.4 EV for the sun
 ~12.2 EV for the sky
That is as a ballpark. All still influenced by surroundings, accuracy parameters, fov of the sensor…


EV calculator
https://www.scantips.com/lights/evchart.html#calc
http://www.fredparker.com/ultexp1.htm
Exposure value is basically used to indicate an interval on the photographic exposure scale, with a difference of 1 EV corresponding to a standard power-of-2 exposure step, also commonly referred to as a “stop”.
https://contrastly.com/a-guide-to-understanding-exposure-value-ev/
Retrieving photographic exposure from an image
All you can hope to measure with your camera and some images is the relative reflected luminance. Even if you have the camera settings. https://en.wikipedia.org/wiki/Relative_luminance
If you REALLY want to know the amount of light in absolute radiometric units, you’re going to need to use some kind of absolute light meter or measured light source to calibrate your camera. For references on how to do this, see: Section 2.5 Obtaining Absolute Radiance from http://www.pauldebevec.com/Research/HDR/debevec-siggraph97.pdf
IF you are still trying to gauge relative brightness, the level of the sun in Nuke can vary, but it should be in the thousands. Ie: between 30,000 and 65,0000 rgb value depending on time of the day, season and atmospherics.
The values for a 12 o’clock sun, with the sun sampled at EV 15.5 (shutter 1/30, ISO 100, F22) is 32.000 RGB max values (or 32,000 pixel luminance).
The thing to keep an eye for is the level of contrast between sunny side/fill side. The terminator should be quite obvious, there can be up to 3 stops difference between fill/key in sunny lit objects.Note: In Foundry’s Nuke, the software will map 18% gray to whatever your center f/stop is set to in the viewer settings (f/8 by default… change that to EV by following the instructions below).
You can experiment with this by attaching an Exposure node to a Constant set to 0.18, setting your viewer read-out to Spotmeter, and adjusting the stops in the node up and down. You will see that a full stop up or down will give you the respective next value on the aperture scale (f8, f11, f16 etc.).
One stop doubles or halves the amount or light that hits the filmback/ccd, so everything works in powers of 2.
So starting with 0.18 in your constant, you will see that raising it by a stop will give you .36 as a floating point number (in linear space), while your f/stop will be f/11 and so on.If you set your center stop to 0 (see below) you will get a relative readout in EVs, where EV 0 again equals 18% constant gray.
Note: make sure to set your Nuke read node to ‘raw data’
In other words. Setting the center f-stop to 0 means that in a neutral plate, the middle gray in the macbeth chart will equal to exposure value 0. EV 0 corresponds to an exposure time of 1 sec and an aperture of f/1.0.
To switch Foundry’s Nuke’s SpotMeter to return the EV of an image, click on the main viewport, and then press s, this opens the viewer’s properties. Now set the center f-stop to 0 in there. And the SpotMeter in the viewport will change from aperture and fstops to EV.
If you are trying to gauge the EV from the pixel luminance in the image:
– Setting the center f-stop to 0 means that in a neutral plate, the middle 18% gray will equal to exposure value 0.
– So if EV 0 = 0.18 middle gray in nuke which equal to a pixel luminance of 0.18, doubling that value, doubles the EV..18 pixel luminance = 0EV .36 pixel luminance = 1EV .72 pixel luminance = 2EV 1.46 pixel luminance = 3EV ...
This is a Geometric Progression function: xn = ar(n-1)
The most basic example of this function is 1,2,4,8,16,32,… The sequence starts at 1 and doubles each time, so
- a=1 (the first term)
- r=2 (the “common ratio” between terms is a doubling)
And we get:
{a, ar, ar2, ar3, … }
= {1, 1×2, 1×22, 1×23, … }
= {1, 2, 4, 8, … }
In this example the function translates to: n = 2(n-1)
You can graph this curve through this expression: x = 2(y-1) :
You can go back and forth between the two values through a geometric progression function and a log function:
(Note: in a spreadsheet this is: = POWER(2; cell# -1) and =LOG(cell#, 2)+1) )
2(y-1) log2(x)+1 x y 1 1 2 2 4 3 8 4 16 5 32 6 64 7 128 8 256 9 512 10 1024 11 2048 12 4096 13 Translating this into a geometric progression between an image pixel luminance and EV:
-
DiffusionLight: HDRI Light Probes for Free by Painting a Chrome Ball
Read more: DiffusionLight: HDRI Light Probes for Free by Painting a Chrome Ballhttps://diffusionlight.github.io/
https://github.com/DiffusionLight/DiffusionLight
https://github.com/DiffusionLight/DiffusionLight?tab=MIT-1-ov-file#readme
https://colab.research.google.com/drive/15pC4qb9mEtRYsW3utXkk-jnaeVxUy-0S
“a simple yet effective technique to estimate lighting in a single input image. Current techniques rely heavily on HDR panorama datasets to train neural networks to regress an input with limited field-of-view to a full environment map. However, these approaches often struggle with real-world, uncontrolled settings due to the limited diversity and size of their datasets. To address this problem, we leverage diffusion models trained on billions of standard images to render a chrome ball into the input image. Despite its simplicity, this task remains challenging: the diffusion models often insert incorrect or inconsistent objects and cannot readily generate images in HDR format. Our research uncovers a surprising relationship between the appearance of chrome balls and the initial diffusion noise map, which we utilize to consistently generate high-quality chrome balls. We further fine-tune an LDR difusion model (Stable Diffusion XL) with LoRA, enabling it to perform exposure bracketing for HDR light estimation. Our method produces convincing light estimates across diverse settings and demonstrates superior generalization to in-the-wild scenarios.”

-
Sun cone angle (angular diameter) as perceived by earth viewers
Read more: Sun cone angle (angular diameter) as perceived by earth viewersAlso see:
https://www.pixelsham.com/2020/08/01/solid-angle-measures/
The cone angle of the sun refers to the angular diameter of the sun as observed from Earth, which is related to the apparent size of the sun in the sky.
The angular diameter of the sun, or the cone angle of the sunlight as perceived from Earth, is approximately 0.53 degrees on average. This value can vary slightly due to the elliptical nature of Earth’s orbit around the sun, but it generally stays within a narrow range.
Here’s a more precise breakdown:
-
- Average Angular Diameter: About 0.53 degrees (31 arcminutes)
- Minimum Angular Diameter: Approximately 0.52 degrees (when Earth is at aphelion, the farthest point from the sun)
- Maximum Angular Diameter: Approximately 0.54 degrees (when Earth is at perihelion, the closest point to the sun)
This angular diameter remains relatively constant throughout the day because the sun’s distance from Earth does not change significantly over a single day.
To summarize, the cone angle of the sun’s light, or its angular diameter, is typically around 0.53 degrees, regardless of the time of day.
https://en.wikipedia.org/wiki/Angular_diameter

-
-
Composition – These are the basic lighting techniques you need to know for photography and film
Read more: Composition – These are the basic lighting techniques you need to know for photography and film
http://www.diyphotography.net/basic-lighting-techniques-need-know-photography-film/
Amongst the basic techniques, there’s…
1- Side lighting – Literally how it sounds, lighting a subject from the side when they’re faced toward you
2- Rembrandt lighting – Here the light is at around 45 degrees over from the front of the subject, raised and pointing down at 45 degrees
3- Back lighting – Again, how it sounds, lighting a subject from behind. This can help to add drama with silouettes
4- Rim lighting – This produces a light glowing outline around your subject
5- Key light – The main light source, and it’s not necessarily always the brightest light source
6- Fill light – This is used to fill in the shadows and provide detail that would otherwise be blackness
7- Cross lighting – Using two lights placed opposite from each other to light two subjects
-
Lighting Every Darkness with 3DGS: Fast Training and Real-Time Rendering and Denoising for HDR View Synthesis
Read more: Lighting Every Darkness with 3DGS: Fast Training and Real-Time Rendering and Denoising for HDR View Synthesishttps://srameo.github.io/projects/le3d/
LE3D is a method for real-time HDR view synthesis from RAW images. It is particularly effective for nighttime scenes.
https://github.com/Srameo/LE3D


-
How are Energy and Matter the Same?
Read more: How are Energy and Matter the Same?www.turnerpublishing.com/blog/detail/everything-is-energy-everything-is-one-everything-is-possible/
www.universetoday.com/116615/how-are-energy-and-matter-the-same/
As Einstein showed us, light and matter and just aspects of the same thing. Matter is just frozen light. And light is matter on the move. Albert Einstein’s most famous equation says that energy and matter are two sides of the same coin. How does one become the other?
Relativity requires that the faster an object moves, the more mass it appears to have. This means that somehow part of the energy of the car’s motion appears to transform into mass. Hence the origin of Einstein’s equation. How does that happen? We don’t really know. We only know that it does.
Matter is 99.999999999999 percent empty space. Not only do the atom and solid matter consist mainly of empty space, it is the same in outer space
The quantum theory researchers discovered the answer: Not only do particles consist of energy, but so does the space between. This is the so-called zero-point energy. Therefore it is true: Everything consists of energy.
Energy is the basis of material reality. Every type of particle is conceived of as a quantum vibration in a field: Electrons are vibrations in electron fields, protons vibrate in a proton field, and so on. Everything is energy, and everything is connected to everything else through fields.

-
What light is best to illuminate gems for resale
Read more: What light is best to illuminate gems for resalewww.palagems.com/gem-lighting2
Artificial light sources, not unlike the diverse phases of natural light, vary considerably in their properties. As a result, some lamps render an object’s color better than others do.
The most important criterion for assessing the color-rendering ability of any lamp is its spectral power distribution curve.
Natural daylight varies too much in strength and spectral composition to be taken seriously as a lighting standard for grading and dealing colored stones. For anything to be a standard, it must be constant in its properties, which natural light is not.
For dealers in particular to make the transition from natural light to an artificial light source, that source must offer:
1- A degree of illuminance at least as strong as the common phases of natural daylight.
2- Spectral properties identical or comparable to a phase of natural daylight.A source combining these two things makes gems appear much the same as when viewed under a given phase of natural light. From the viewpoint of many dealers, this corresponds to a naturalappearance.
The 6000° Kelvin xenon short-arc lamp appears closest to meeting the criteria for a standard light source. Besides the strong illuminance this lamp affords, its spectrum is very similar to CIE standard illuminants of similar color temperature.


-
How to Direct and Edit a Fight Scene for Rhythm and Pacing
Read more: How to Direct and Edit a Fight Scene for Rhythm and Pacingwww.premiumbeat.com/blog/directing-fight-scene-cinematography/

1- Frame the action
2- Stage the action
3- Use camera movements
4- Set a rhythm
5- Control the speed of the action
-
Willem Zwarthoed – Aces gamut in VFX production pdf
Read more: Willem Zwarthoed – Aces gamut in VFX production pdfhttps://www.provideocoalition.com/color-management-part-12-introducing-aces/
Local copy:
https://www.slideshare.net/hpduiker/acescg-a-common-color-encoding-for-visual-effects-applications


COLLECTIONS
| Featured AI
| Design And Composition
| Explore posts
POPULAR SEARCHES
unreal | pipeline | virtual production | free | learn | photoshop | 360 | macro | google | nvidia | resolution | open source | hdri | real-time | photography basics | nuke
FEATURED POSTS
Social Links
DISCLAIMER – Links and images on this website may be protected by the respective owners’ copyright. All data submitted by users through this site shall be treated as freely available to share.
