


COMPOSITION
-
SlowMoVideo – How to make a slow motion shot with the open source program
Read more: SlowMoVideo – How to make a slow motion shot with the open source programhttp://slowmovideo.granjow.net/
slowmoVideo is an OpenSource program that creates slow-motion videos from your footage.
Slow motion cinematography is the result of playing back frames for a longer duration than they were exposed. For example, if you expose 240 frames of film in one second, then play them back at 24 fps, the resulting movie is 10 times longer (slower) than the original filmed event….
Film cameras are relatively simple mechanical devices that allow you to crank up the speed to whatever rate the shutter and pull-down mechanism allow. Some film cameras can operate at 2,500 fps or higher (although film shot in these cameras often needs some readjustment in postproduction). Video, on the other hand, is always captured, recorded, and played back at a fixed rate, with a current limit around 60fps. This makes extreme slow motion effects harder to achieve (and less elegant) on video, because slowing down the video results in each frame held still on the screen for a long time, whereas with high-frame-rate film there are plenty of frames to fill the longer durations of time. On video, the slow motion effect is more like a slide show than smooth, continuous motion.
One obvious solution is to shoot film at high speed, then transfer it to video (a case where film still has a clear advantage, sorry George). Another possibility is to cross dissolve or blur from one frame to the next. This adds a smooth transition from one still frame to the next. The blur reduces the sharpness of the image, and compared to slowing down images shot at a high frame rate, this is somewhat of a cheat. However, there isn’t much you can do about it until video can be recorded at much higher rates. Of course, many film cameras can’t shoot at high frame rates either, so the whole super-slow-motion endeavor is somewhat specialized no matter what medium you are using. (There are some high speed digital cameras available now that allow you to capture lots of digital frames directly to your computer, so technology is starting to catch up with film. However, this feature isn’t going to appear in consumer camcorders any time soon.)


DESIGN
-
Principles of Interior Design – Balance
Read more: Principles of Interior Design – Balancehttps://www.yankodesign.com/2024/09/18/principles-of-interior-design-balance
The three types of balance include:
- Symmetrical Balance
- Asymmetrical Balance
- Radial Balance

-


COLOR
-
Victor Perez – The Color Management Handbook for Visual Effects Artists
Read more: Victor Perez – The Color Management Handbook for Visual Effects ArtistsDigital Color Principles, Color Management Fundamentals & ACES Workflows

-
Virtual Production volumes study
Read more: Virtual Production volumes studyColor Fidelity in LED Volumes
https://theasc.com/articles/color-fidelity-in-led-volumes
Virtual Production Glossary
https://vpglossary.com/What is Virtual Production – In depth analysis
https://www.leadingledtech.com/what-is-a-led-virtual-production-studio-in-depth-technical-analysis/
A comparison of LED panels for use in Virtual Production:
Findings and recommendations
https://eprints.bournemouth.ac.uk/36826/1/LED_Comparison_White_Paper%281%29.pdf -
What is a Gamut or Color Space and why do I need to know about CIE
Read more: What is a Gamut or Color Space and why do I need to know about CIE

http://www.xdcam-user.com/2014/05/what-is-a-gamut-or-color-space-and-why-do-i-need-to-know-about-it/
In video terms gamut is normally related to as the full range of colours and brightness that can be either captured or displayed.
Generally speaking all color gamuts recommendations are trying to define a reasonable level of color representation based on available technology and hardware. REC-601 represents the old TVs. REC-709 is currently the most distributed solution. P3 is mainly available in movie theaters and is now being adopted in some of the best new 4K HDR TVs. Rec2020 (a wider space than P3 that improves on visibke color representation) and ACES (the full coverage of visible color) are other common standards which see major hardware development these days.

To compare and visualize different solution (across video and printing solutions), most developers use the CIE color model chart as a reference.
The CIE color model is a color space model created by the International Commission on Illumination known as the Commission Internationale de l’Elcairage (CIE) in 1931. It is also known as the CIE XYZ color space or the CIE 1931 XYZ color space.
This chart represents the first defined quantitative link between distributions of wavelengths in the electromagnetic visible spectrum, and physiologically perceived colors in human color vision. Or basically, the range of color a typical human eye can perceive through visible light.
Note that while the human perception is quite wide, and generally speaking biased towards greens (we are apes after all), the amount of colors available through nature, generated through light reflection, tend to be a much smaller section. This is defined by the Pointer’s Chart.


In short. Color gamut is a representation of color coverage, used to describe data stored in images against available hardware and viewer technologies.
Camera color encoding from
https://www.slideshare.net/hpduiker/acescg-a-common-color-encoding-for-visual-effects-applications
CIE 1976
http://bernardsmith.eu/computatrum/scan_and_restore_archive_and_print/scanning/
https://store.yujiintl.com/blogs/high-cri-led/understanding-cie1931-and-cie-1976
The CIE 1931 standard has been replaced by a CIE 1976 standard. Below we can see the significance of this.
People have observed that the biggest issue with CIE 1931 is the lack of uniformity with chromaticity, the three dimension color space in rectangular coordinates is not visually uniformed.
The CIE 1976 (also called CIELUV) was created by the CIE in 1976. It was put forward in an attempt to provide a more uniform color spacing than CIE 1931 for colors at approximately the same luminance
The CIE 1976 standard colour space is more linear and variations in perceived colour between different people has also been reduced. The disproportionately large green-turquoise area in CIE 1931, which cannot be generated with existing computer screens, has been reduced.
If we move from CIE 1931 to the CIE 1976 standard colour space we can see that the improvements made in the gamut for the “new” iPad screen (as compared to the “old” iPad 2) are more evident in the CIE 1976 colour space than in the CIE 1931 colour space, particularly in the blues from aqua to deep blue.

https://dot-color.com/2012/08/14/color-space-confusion/
Despite its age, CIE 1931, named for the year of its adoption, remains a well-worn and familiar shorthand throughout the display industry. CIE 1931 is the primary language of customers. When a customer says that their current display “can do 72% of NTSC,” they implicitly mean 72% of NTSC 1953 color gamut as mapped against CIE 1931.
-
Björn Ottosson – How software gets color wrong
Read more: Björn Ottosson – How software gets color wronghttps://bottosson.github.io/posts/colorwrong/
Most software around us today are decent at accurately displaying colors. Processing of colors is another story unfortunately, and is often done badly.
To understand what the problem is, let’s start with an example of three ways of blending green and magenta:
- Perceptual blend – A smooth transition using a model designed to mimic human perception of color. The blending is done so that the perceived brightness and color varies smoothly and evenly.
- Linear blend – A model for blending color based on how light behaves physically. This type of blending can occur in many ways naturally, for example when colors are blended together by focus blur in a camera or when viewing a pattern of two colors at a distance.
- sRGB blend – This is how colors would normally be blended in computer software, using sRGB to represent the colors.

Let’s look at some more examples of blending of colors, to see how these problems surface more practically. The examples use strong colors since then the differences are more pronounced. This is using the same three ways of blending colors as the first example.

Instead of making it as easy as possible to work with color, most software make it unnecessarily hard, by doing image processing with representations not designed for it. Approximating the physical behavior of light with linear RGB models is one easy thing to do, but more work is needed to create image representations tailored for image processing and human perception.
Also see:
-
What is OLED and what can it do for your TV
Read more: What is OLED and what can it do for your TVhttps://www.cnet.com/news/what-is-oled-and-what-can-it-do-for-your-tv/
OLED stands for Organic Light Emitting Diode. Each pixel in an OLED display is made of a material that glows when you jab it with electricity. Kind of like the heating elements in a toaster, but with less heat and better resolution. This effect is called electroluminescence, which is one of those delightful words that is big, but actually makes sense: “electro” for electricity, “lumin” for light and “escence” for, well, basically “essence.”
OLED TV marketing often claims “infinite” contrast ratios, and while that might sound like typical hyperbole, it’s one of the extremely rare instances where such claims are actually true. Since OLED can produce a perfect black, emitting no light whatsoever, its contrast ratio (expressed as the brightest white divided by the darkest black) is technically infinite.
OLED is the only technology capable of absolute blacks and extremely bright whites on a per-pixel basis. LCD definitely can’t do that, and even the vaunted, beloved, dearly departed plasma couldn’t do absolute blacks.

-
Anders Langlands – Render Color Spaces
Read more: Anders Langlands – Render Color Spaceshttps://www.colour-science.org/anders-langlands/
This page compares images rendered in Arnold using spectral rendering and different sets of colourspace primaries: Rec.709, Rec.2020, ACES and DCI-P3. The SPD data for the GretagMacbeth Color Checker are the measurements of Noburu Ohta, taken from Mansencal, Mauderer and Parsons (2014) colour-science.org.

-
Tim Kang – calibrated white light values in sRGB color space
Read more: Tim Kang – calibrated white light values in sRGB color space8bit sRGB encoded
2000K 255 139 22
2700K 255 172 89
3000K 255 184 109
3200K 255 190 122
4000K 255 211 165
4300K 255 219 178
D50 255 235 205
D55 255 243 224
D5600 255 244 227
D6000 255 249 240
D65 255 255 255
D10000 202 221 255
D20000 166 196 2558bit Rec709 Gamma 2.4
2000K 255 145 34
2700K 255 177 97
3000K 255 187 117
3200K 255 193 129
4000K 255 214 170
4300K 255 221 182
D50 255 236 208
D55 255 243 226
D5600 255 245 229
D6000 255 250 241
D65 255 255 255
D10000 204 222 255
D20000 170 199 2558bit Display P3 encoded
2000K 255 154 63
2700K 255 185 109
3000K 255 195 127
3200K 255 201 138
4000K 255 219 176
4300K 255 225 187
D50 255 239 212
D55 255 245 228
D5600 255 246 231
D6000 255 251 242
D65 255 255 255
D10000 208 223 255
D20000 175 199 25510bit Rec2020 PQ (100 nits)
2000K 520 435 273
2700K 520 466 358
3000K 520 475 384
3200K 520 480 399
4000K 520 495 446
4300K 520 500 458
D50 520 510 482
D55 520 514 497
D5600 520 514 500
D6000 520 517 509
D65 520 520 520
D10000 479 489 520
D20000 448 464 520
-
Willem Zwarthoed – Aces gamut in VFX production pdf
Read more: Willem Zwarthoed – Aces gamut in VFX production pdfhttps://www.provideocoalition.com/color-management-part-12-introducing-aces/
Local copy:
https://www.slideshare.net/hpduiker/acescg-a-common-color-encoding-for-visual-effects-applications
-
HDR and Color
Read more: HDR and Colorhttps://www.soundandvision.com/content/nits-and-bits-hdr-and-color
In HD we often refer to the range of available colors as a color gamut. Such a color gamut is typically plotted on a two-dimensional diagram, called a CIE chart, as shown in at the top of this blog. Each color is characterized by its x/y coordinates.

Good enough for government work, perhaps. But for HDR, with its higher luminance levels and wider color, the gamut becomes three-dimensional.

For HDR the color gamut therefore becomes a characteristic we now call the color volume. It isn’t easy to show color volume on a two-dimensional medium like the printed page or a computer screen, but one method is shown below. As the luminance becomes higher, the picture eventually turns to white. As it becomes darker, it fades to black. The traditional color gamut shown on the CIE chart is simply a slice through this color volume at a selected luminance level, such as 50%.
Three different color volumes—we still refer to them as color gamuts though their third dimension is important—are currently the most significant. The first is BT.709 (sometimes referred to as Rec.709), the color gamut used for pre-UHD/HDR formats, including standard HD.
The largest is known as BT.2020; it encompasses (roughly) the range of colors visible to the human eye (though ET might find it insufficient!).
Between these two is the color gamut used in digital cinema, known as DCI-P3.

sRGB

D65


LIGHTING
-
Photography basics: Exposure Value vs Photographic Exposure vs Il/Luminance vs Pixel luminance measurements
Read more: Photography basics: Exposure Value vs Photographic Exposure vs Il/Luminance vs Pixel luminance measurementsAlso see: https://www.pixelsham.com/2015/05/16/how-aperture-shutter-speed-and-iso-affect-your-photos/
In photography, exposure value (EV) is a number that represents a combination of a camera’s shutter speed and f-number, such that all combinations that yield the same exposure have the same EV (for any fixed scene luminance).

The EV concept was developed in an attempt to simplify choosing among combinations of equivalent camera settings. Although all camera settings with the same EV nominally give the same exposure, they do not necessarily give the same picture. EV is also used to indicate an interval on the photographic exposure scale. 1 EV corresponding to a standard power-of-2 exposure step, commonly referred to as a stop
EV 0 corresponds to an exposure time of 1 sec and a relative aperture of f/1.0. If the EV is known, it can be used to select combinations of exposure time and f-number.
Note EV does not equal to photographic exposure. Photographic Exposure is defined as how much light hits the camera’s sensor. It depends on the camera settings mainly aperture and shutter speed. Exposure value (known as EV) is a number that represents the exposure setting of the camera.
Thus, strictly, EV is not a measure of luminance (indirect or reflected exposure) or illuminance (incidental exposure); rather, an EV corresponds to a luminance (or illuminance) for which a camera with a given ISO speed would use the indicated EV to obtain the nominally correct exposure. Nonetheless, it is common practice among photographic equipment manufacturers to express luminance in EV for ISO 100 speed, as when specifying metering range or autofocus sensitivity.
The exposure depends on two things: how much light gets through the lenses to the camera’s sensor and for how long the sensor is exposed. The former is a function of the aperture value while the latter is a function of the shutter speed. Exposure value is a number that represents this potential amount of light that could hit the sensor. It is important to understand that exposure value is a measure of how exposed the sensor is to light and not a measure of how much light actually hits the sensor. The exposure value is independent of how lit the scene is. For example a pair of aperture value and shutter speed represents the same exposure value both if the camera is used during a very bright day or during a dark night.
Each exposure value number represents all the possible shutter and aperture settings that result in the same exposure. Although the exposure value is the same for different combinations of aperture values and shutter speeds the resulting photo can be very different (the aperture controls the depth of field while shutter speed controls how much motion is captured).
EV 0.0 is defined as the exposure when setting the aperture to f-number 1.0 and the shutter speed to 1 second. All other exposure values are relative to that number. Exposure values are on a base two logarithmic scale. This means that every single step of EV – plus or minus 1 – represents the exposure (actual light that hits the sensor) being halved or doubled.
https://www.streetdirectory.com/travel_guide/141307/photography/exposure_value_ev_and_exposure_compensation.html
Formula
https://en.wikipedia.org/wiki/Exposure_value
https://www.scantips.com/lights/math.html

which means 2EV = N² / t
where
- N is the relative aperture (f-number) Important: Note that f/stop values must first be squared in most calculations
- t is the exposure time (shutter speed) in seconds
EV 0 corresponds to an exposure time of 1 sec and an aperture of f/1.0.
Example: If f/16 and 1/4 second, then this is:
(N² / t) = (16 × 16 ÷ 1/4) = (16 × 16 × 4) = 1024.
Log₂(1024) is EV 10. Meaning, 210 = 1024.
Collecting photographic exposure using Light Meters
The exposure meter in the camera does not know whether the subject itself is bright or not. It simply measures the amount of light that comes in, and makes a guess based on that. The camera will aim for 18% gray, meaning if you take a photo of an entirely white surface, and an entirely black surface you should get two identical images which both are gray (at least in theory)
https://en.wikipedia.org/wiki/Light_meter
For reflected-light meters, camera settings are related to ISO speed and subject luminance by the reflected-light exposure equation:

where
- N is the relative aperture (f-number)
- t is the exposure time (“shutter speed”) in seconds
- L is the average scene luminance
- S is the ISO arithmetic speed
- K is the reflected-light meter calibration constant
For incident-light meters, camera settings are related to ISO speed and subject illuminance by the incident-light exposure equation:

where
- E is the illuminance (in lux)
- C is the incident-light meter calibration constant
Two values for K are in common use: 12.5 (Canon, Nikon, and Sekonic) and 14 (Minolta, Kenko, and Pentax); the difference between the two values is approximately 1/6 EV.
For C a value of 250 is commonly used.Nonetheless, it is common practice among photographic equipment manufacturers to also express luminance in EV for ISO 100 speed. Using K = 12.5, the relationship between EV at ISO 100 and luminance L is then :
L = 2(EV-3)
The situation with incident-light meters is more complicated than that for reflected-light meters, because the calibration constant C depends on the sensor type. Illuminance is measured with a flat sensor; a typical value for C is 250 with illuminance in lux. Using C = 250, the relationship between EV at ISO 100 and illuminance E is then :
E = 2.5 * 2(EV)
https://nofilmschool.com/2018/03/want-easier-and-faster-way-calculate-exposure-formula
Three basic factors go into the exposure formula itself instead: aperture, shutter, and ISO. Plus a light meter calibration constant.
f-stop²/shutter (in seconds) = lux * ISO/C
If you at least know four of those variables, you’ll be able to calculate the missing value.
So, say you want to figure out how much light you’re going to need in order to shoot at a certain f-stop. Well, all you do is plug in your values (you should know the f-stop, ISO, and your light meter calibration constant) into the formula below:
lux = C (f-stop²/shutter (in seconds))/ISO
Exposure Value Calculator:
https://snapheadshots.com/resources/exposure-and-light-calculator
https://www.scantips.com/lights/exposurecalc.html
https://www.pointsinfocus.com/tools/exposure-settings-ev-calculator/#google_vignette
From that perspective, an exposure stop is a measurement of Exposure and provides a universal linear scale to measure the increase and decrease in light, exposed to the image sensor, due to changes in shutter speed, iso & f-stop.
+-1 stop is a doubling or halving of the amount of light let in when taking a photo.
1 EV is just another way to say one stop of exposure change.One major use of EV (Exposure Value) is just to measure any change of exposure, where one EV implies a change of one stop of exposure. Like when we compensate our picture in the camera.
If the picture comes out too dark, our manual exposure could correct the next one by directly adjusting one of the three exposure controls (f/stop, shutter speed, or ISO). Or if using camera automation, the camera meter is controlling it, but we might apply +1 EV exposure compensation (or +1 EV flash compensation) to make the result goal brighter, as desired. This use of 1 EV is just another way to say one stop of exposure change.
On a perfect day the difference from sampling the sky vs the sun exposure with diffusing spot meters is about 3.2 exposure difference.
 ~15.4 EV for the sun
 ~12.2 EV for the sky
That is as a ballpark. All still influenced by surroundings, accuracy parameters, fov of the sensor…


EV calculator
https://www.scantips.com/lights/evchart.html#calc
http://www.fredparker.com/ultexp1.htm
Exposure value is basically used to indicate an interval on the photographic exposure scale, with a difference of 1 EV corresponding to a standard power-of-2 exposure step, also commonly referred to as a “stop”.
https://contrastly.com/a-guide-to-understanding-exposure-value-ev/
Retrieving photographic exposure from an image
All you can hope to measure with your camera and some images is the relative reflected luminance. Even if you have the camera settings. https://en.wikipedia.org/wiki/Relative_luminance
If you REALLY want to know the amount of light in absolute radiometric units, you’re going to need to use some kind of absolute light meter or measured light source to calibrate your camera. For references on how to do this, see: Section 2.5 Obtaining Absolute Radiance from http://www.pauldebevec.com/Research/HDR/debevec-siggraph97.pdf
IF you are still trying to gauge relative brightness, the level of the sun in Nuke can vary, but it should be in the thousands. Ie: between 30,000 and 65,0000 rgb value depending on time of the day, season and atmospherics.
The values for a 12 o’clock sun, with the sun sampled at EV 15.5 (shutter 1/30, ISO 100, F22) is 32.000 RGB max values (or 32,000 pixel luminance).
The thing to keep an eye for is the level of contrast between sunny side/fill side. The terminator should be quite obvious, there can be up to 3 stops difference between fill/key in sunny lit objects.Note: In Foundry’s Nuke, the software will map 18% gray to whatever your center f/stop is set to in the viewer settings (f/8 by default… change that to EV by following the instructions below).
You can experiment with this by attaching an Exposure node to a Constant set to 0.18, setting your viewer read-out to Spotmeter, and adjusting the stops in the node up and down. You will see that a full stop up or down will give you the respective next value on the aperture scale (f8, f11, f16 etc.).
One stop doubles or halves the amount or light that hits the filmback/ccd, so everything works in powers of 2.
So starting with 0.18 in your constant, you will see that raising it by a stop will give you .36 as a floating point number (in linear space), while your f/stop will be f/11 and so on.If you set your center stop to 0 (see below) you will get a relative readout in EVs, where EV 0 again equals 18% constant gray.
Note: make sure to set your Nuke read node to ‘raw data’
In other words. Setting the center f-stop to 0 means that in a neutral plate, the middle gray in the macbeth chart will equal to exposure value 0. EV 0 corresponds to an exposure time of 1 sec and an aperture of f/1.0.
To switch Foundry’s Nuke’s SpotMeter to return the EV of an image, click on the main viewport, and then press s, this opens the viewer’s properties. Now set the center f-stop to 0 in there. And the SpotMeter in the viewport will change from aperture and fstops to EV.
If you are trying to gauge the EV from the pixel luminance in the image:
– Setting the center f-stop to 0 means that in a neutral plate, the middle 18% gray will equal to exposure value 0.
– So if EV 0 = 0.18 middle gray in nuke which equal to a pixel luminance of 0.18, doubling that value, doubles the EV..18 pixel luminance = 0EV .36 pixel luminance = 1EV .72 pixel luminance = 2EV 1.46 pixel luminance = 3EV ...
This is a Geometric Progression function: xn = ar(n-1)
The most basic example of this function is 1,2,4,8,16,32,… The sequence starts at 1 and doubles each time, so
- a=1 (the first term)
- r=2 (the “common ratio” between terms is a doubling)
And we get:
{a, ar, ar2, ar3, … }
= {1, 1×2, 1×22, 1×23, … }
= {1, 2, 4, 8, … }
In this example the function translates to: n = 2(n-1)
You can graph this curve through this expression: x = 2(y-1) :
You can go back and forth between the two values through a geometric progression function and a log function:
(Note: in a spreadsheet this is: = POWER(2; cell# -1) and =LOG(cell#, 2)+1) )
2(y-1) log2(x)+1 x y 1 1 2 2 4 3 8 4 16 5 32 6 64 7 128 8 256 9 512 10 1024 11 2048 12 4096 13 Translating this into a geometric progression between an image pixel luminance and EV:
-
studiobinder.com – What is Tenebrism and Hard Lighting — The Art of Light and Shadow and chiaroscuro Explained
Read more: studiobinder.com – What is Tenebrism and Hard Lighting — The Art of Light and Shadow and chiaroscuro Explainedhttps://www.studiobinder.com/blog/what-is-tenebrism-art-definition/
https://www.studiobinder.com/blog/what-is-hard-light-photography/


-
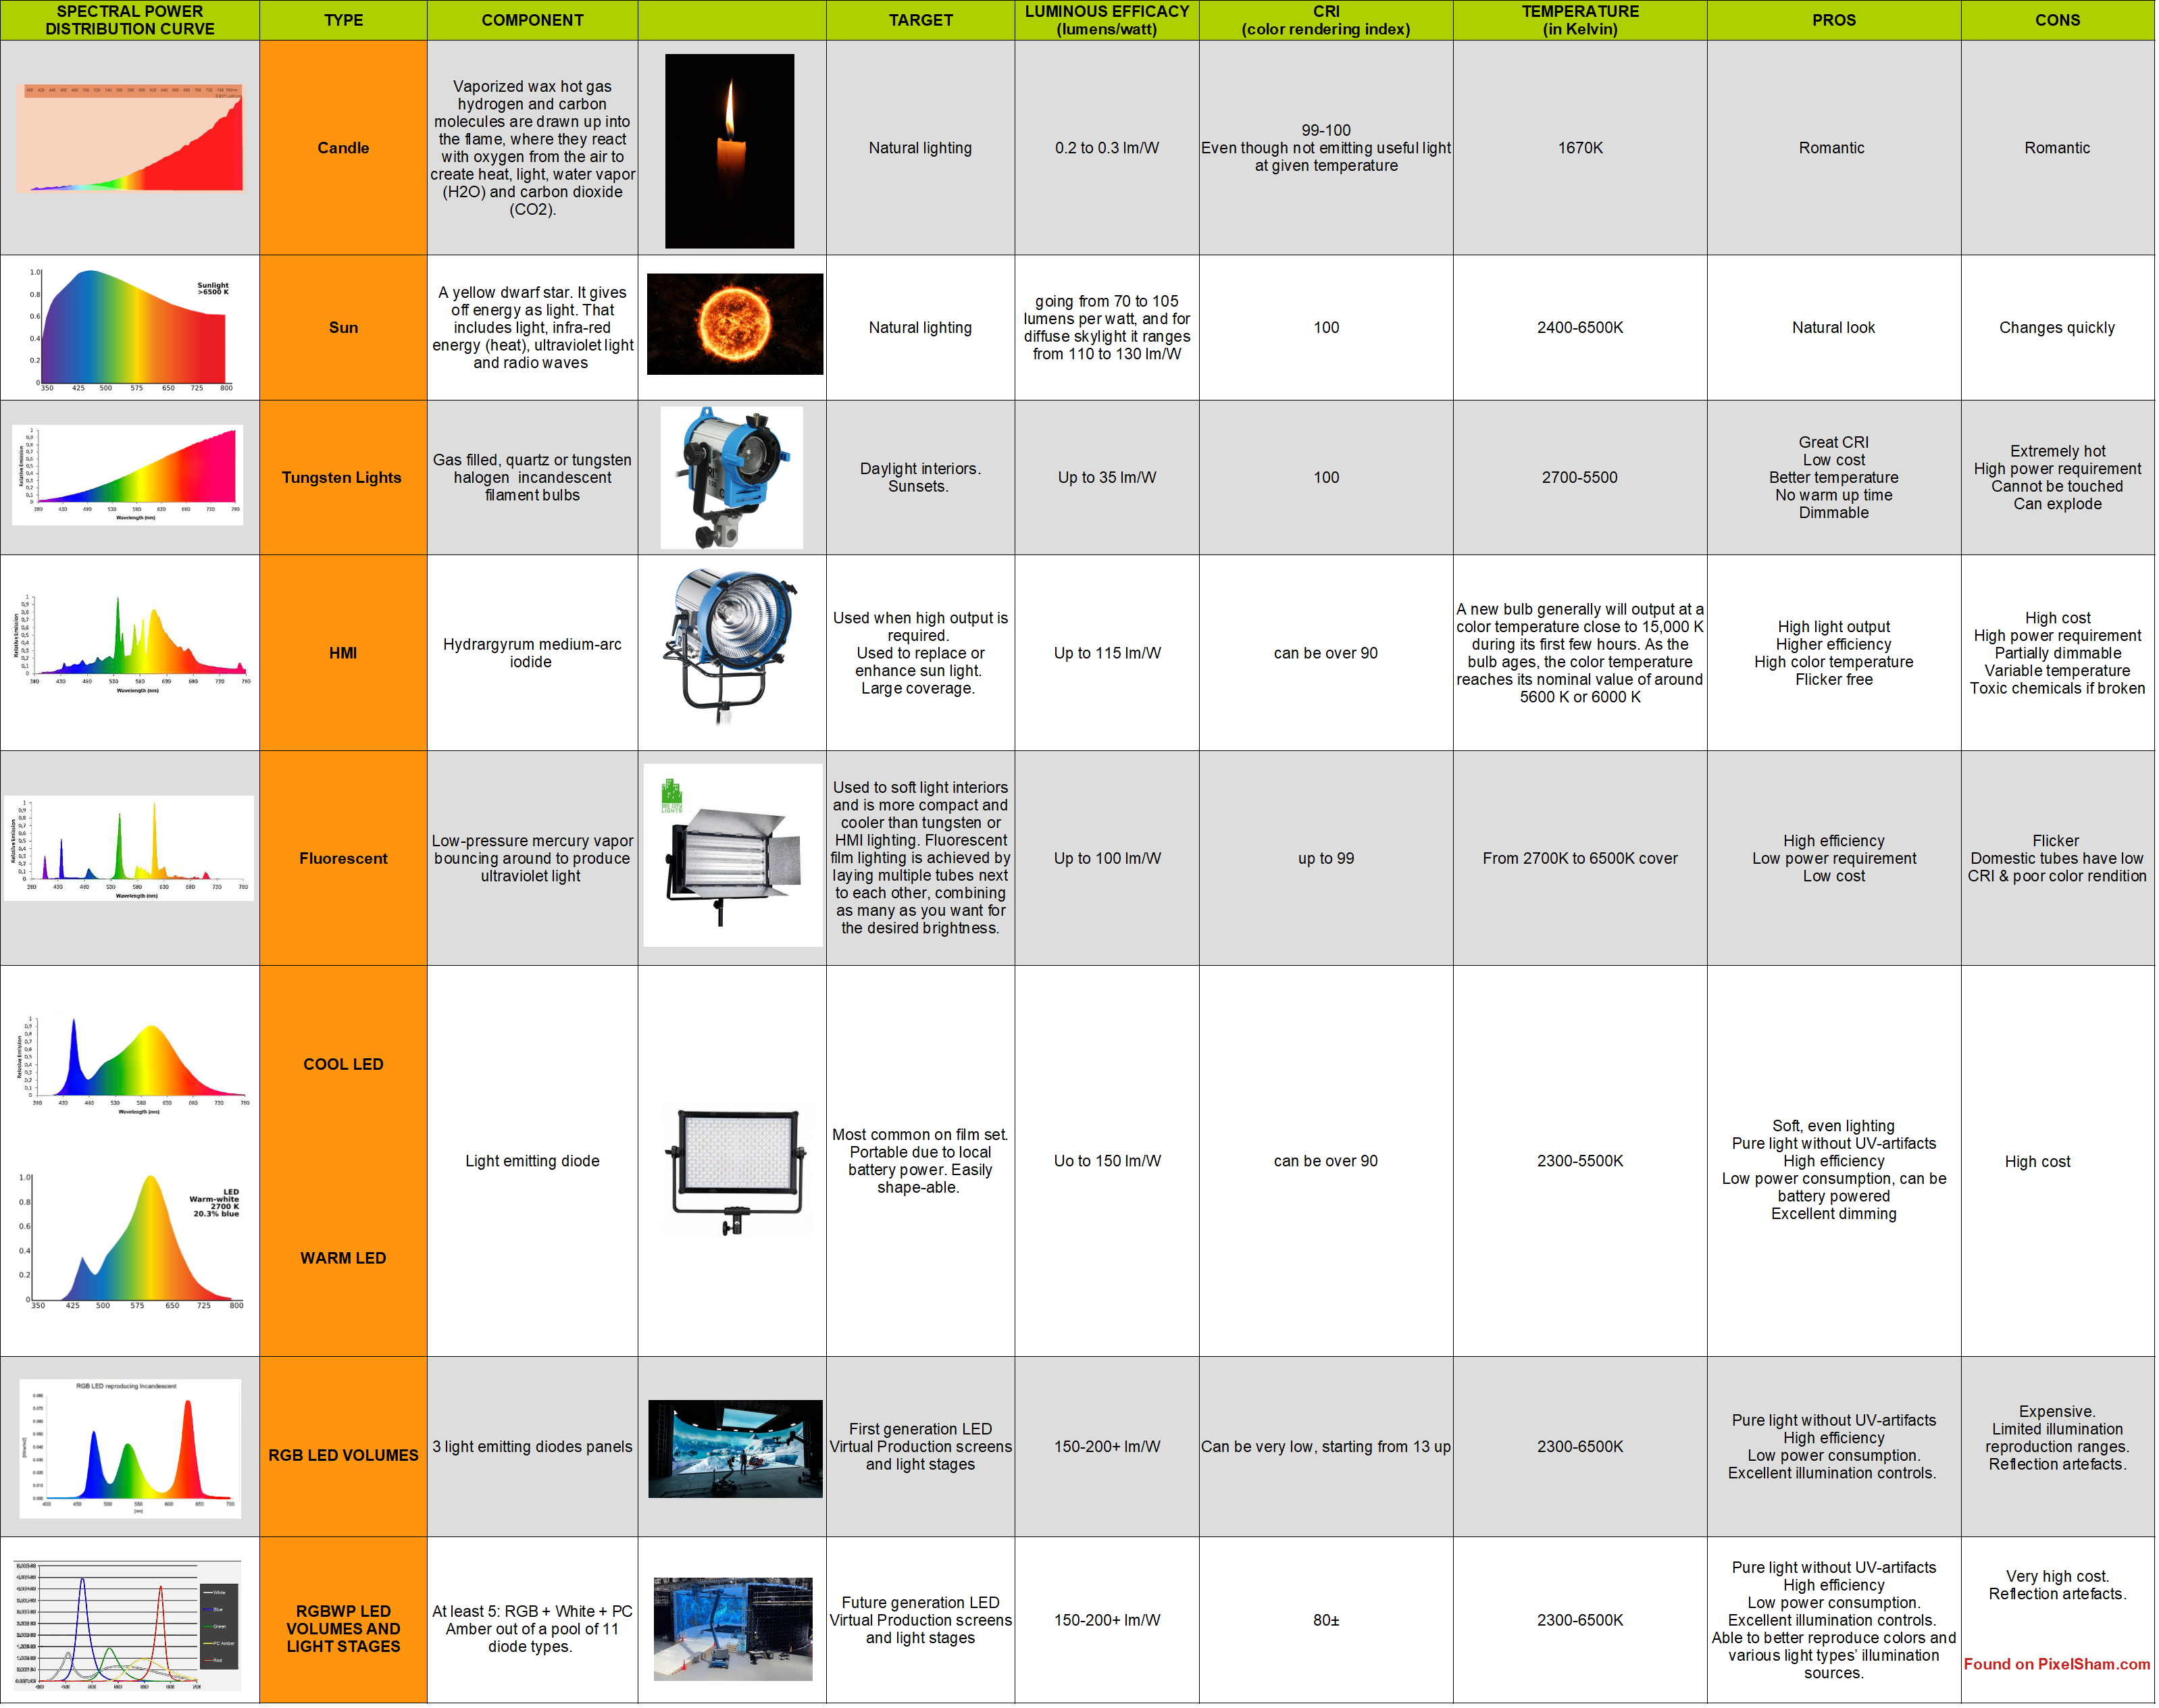
Types of Film Lights and their efficiency – CRI, Color Temperature and Luminous Efficacy
Read more: Types of Film Lights and their efficiency – CRI, Color Temperature and Luminous Efficacynofilmschool.com/types-of-film-lights
“Not every light performs the same way. Lights and lighting are tricky to handle. You have to plan for every circumstance. But the good news is, lighting can be adjusted. Let’s look at different factors that affect lighting in every scene you shoot. ”
Use CRI, Luminous Efficacy and color temperature controls to match your needs.

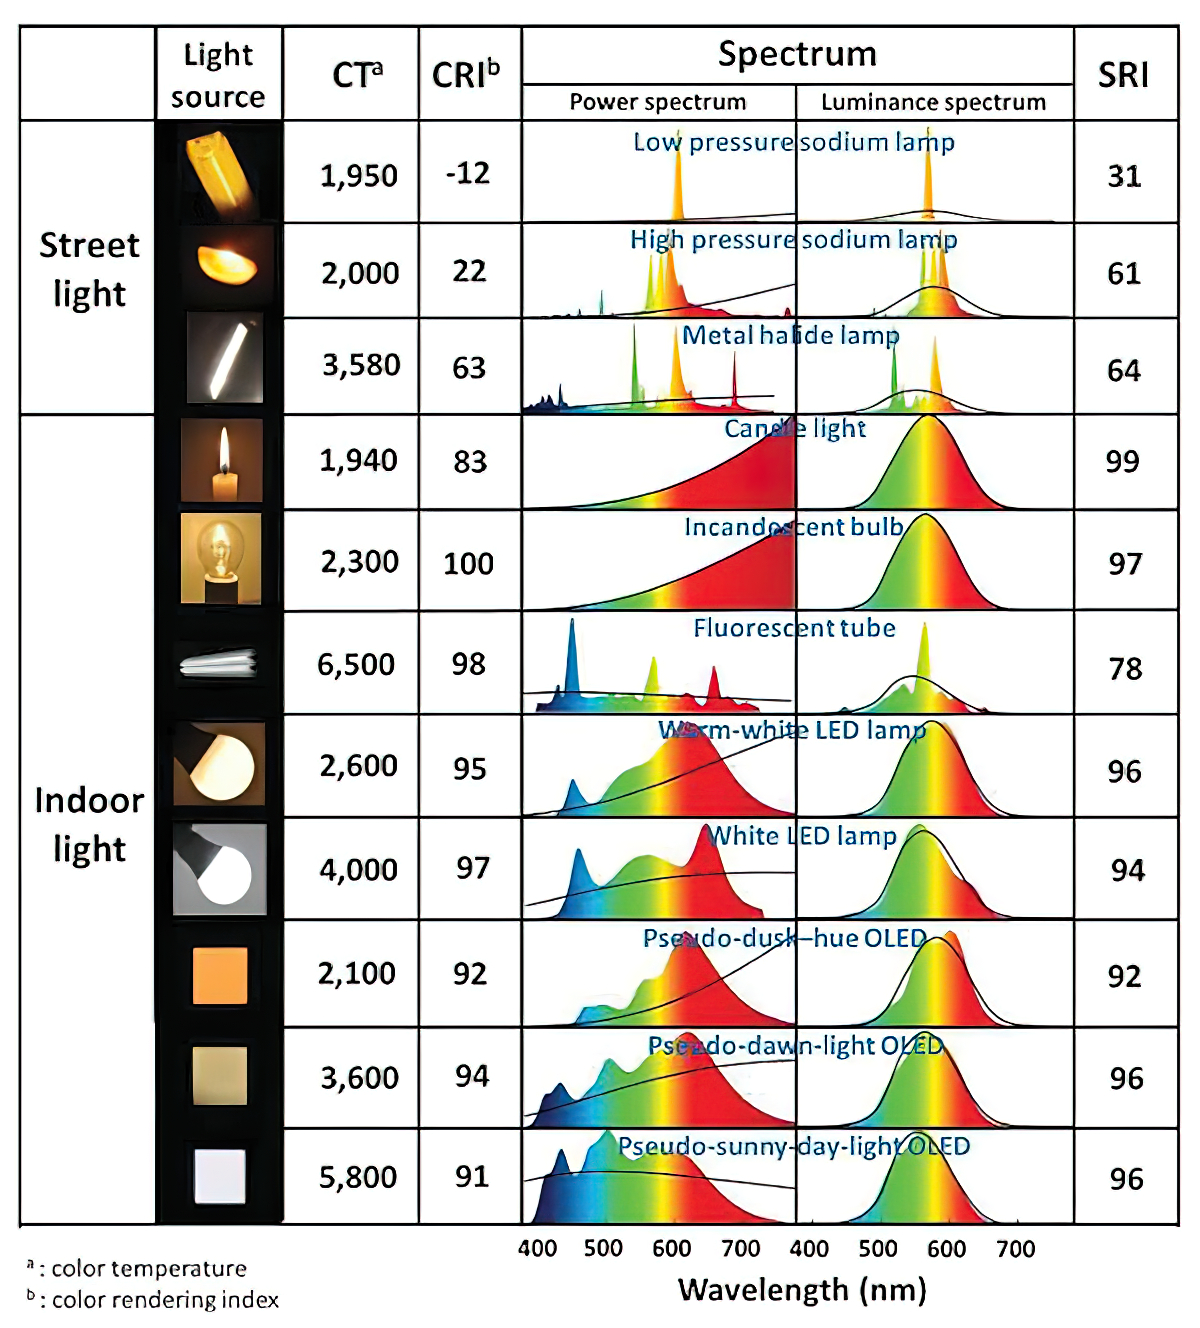
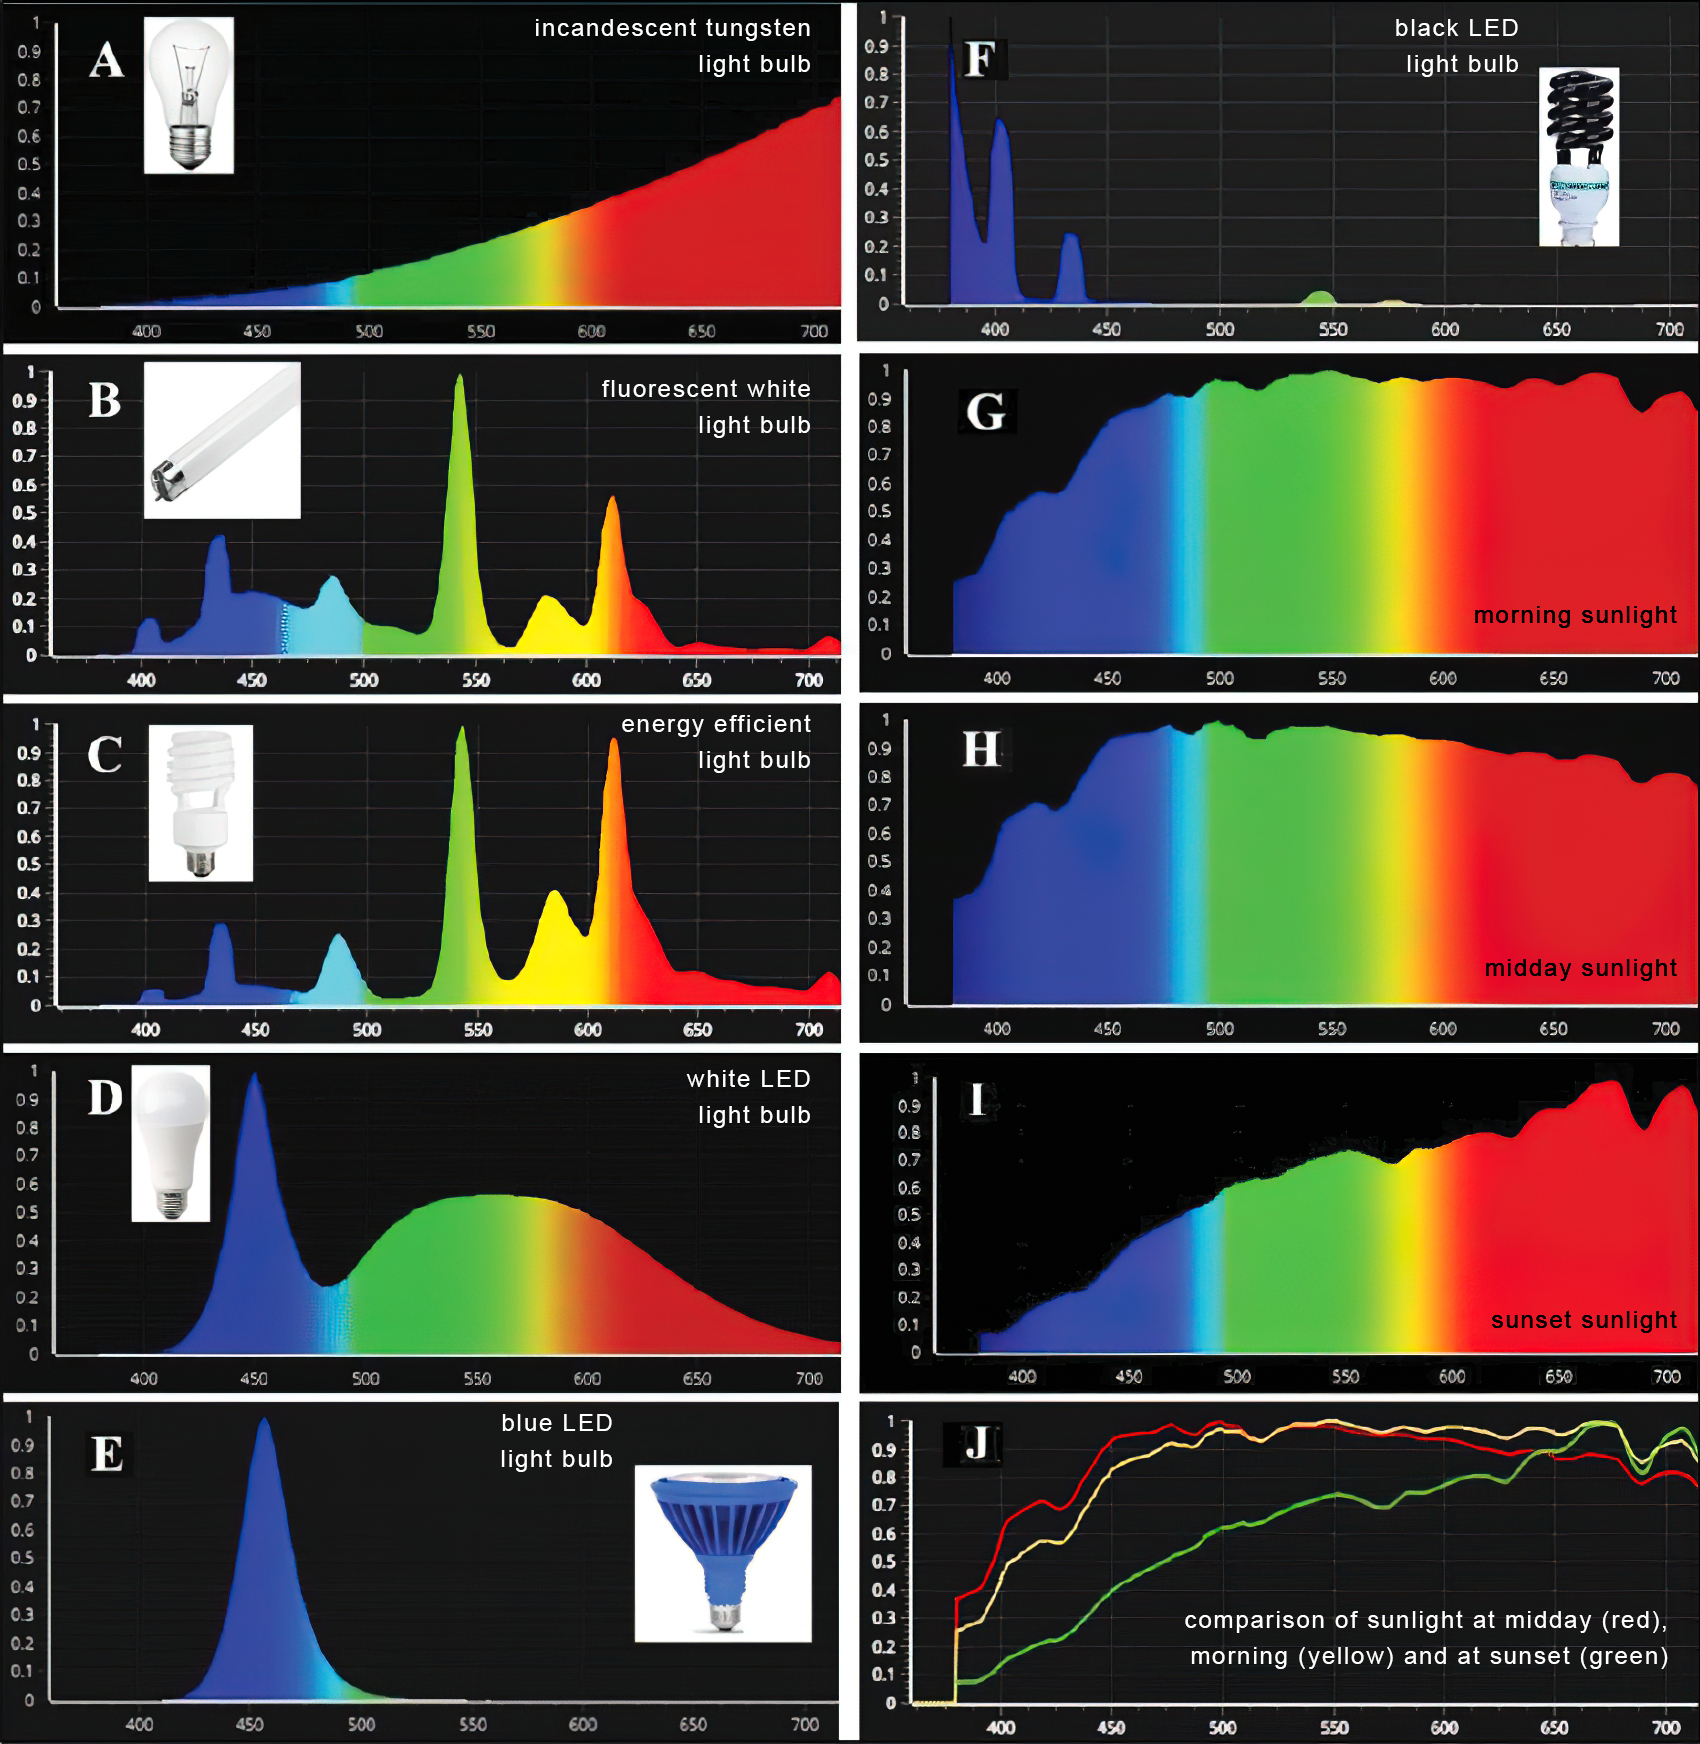
Color Temperature
Color temperature describes the “color” of white light by a light source radiated by a perfect black body at a given temperature measured in degrees Kelvinhttps://www.pixelsham.com/2019/10/18/color-temperature/
CRI
“The Color Rendering Index is a measurement of how faithfully a light source reveals the colors of whatever it illuminates, it describes the ability of a light source to reveal the color of an object, as compared to the color a natural light source would provide. The highest possible CRI is 100. A CRI of 100 generally refers to a perfect black body, like a tungsten light source or the sun. ”https://www.studiobinder.com/blog/what-is-color-rendering-index/


https://en.wikipedia.org/wiki/Color_rendering_index
Light source CCT (K) CRI Low-pressure sodium (LPS/SOX) 1800 −44 Clear mercury-vapor 6410 17 High-pressure sodium (HPS/SON) 2100 24 Coated mercury-vapor 3600 49 Halophosphate warm-white fluorescent 2940 51 Halophosphate cool-white fluorescent 4230 64 Tri-phosphor warm-white fluorescent 2940 73 Halophosphate cool-daylight fluorescent 6430 76 “White” SON 2700 82 Standard LED Lamp 2700–5000 83 Quartz metal halide 4200 85 Tri-phosphor cool-white fluorescent 4080 89 High-CRI LED lamp (blue LED) 2700–5000 95 Ceramic discharge metal-halide lamp 5400 96 Ultra-high-CRI LED lamp (violet LED) 2700–5000 99 Incandescent/halogen bulb 3200 100 Luminous Efficacy
Luminous efficacy is a measure of how well a light source produces visible light, watts out versus watts in, measured in lumens per watt. In other words it is a measurement that indicates the ability of a light source to emit visible light using a given amount of power. It is a ratio of the visible energy to the power that goes into the bulb.FILM LIGHT TYPES
Consumer light types
Tungsten Lights
Light interiors and match domestic places or office locations. Daylight.Advantages of Tungsten Lights
Almost perfect color rendition
Low cost
Does not use mercury like CFLs (fluorescent) or mercury vapor lights
Better color temperature than standard tungsten
Longer life than a conventional incandescent
Instant on to full brightness, no warm-up time, and it is dimmableDisadvantages of Tungsten Lights
Extremely hot
High power requirement
The lamp is sensitive to oils and cannot be touched
The bulb is capable of blowing and sending hot glass shards outward. A screen or layer of glass on the outside of the lamp can protect users.Hydrargyrum medium-arc iodide lights
HMI’s are used when high output is required. They are also used to recreate sun shining through windows or to fake additional sun while shooting exteriors. HMIs can light huge areas at once.Advantages of HMI lights
High light output
Higher efficiency
High color temperatureDisadvantages of HMI lights:
High cost
High power requirement
Dims only to about 50%
the color temperature increases with dimming
HMI bulbs will explode is dropped and release toxic chemicalsFluorescent
Fluorescent film lighting is achieved by laying multiple tubes next to each other, combining as many as you want for the desired brightness. The good news is you can choose your bulbs to either be warm or cool depending on the scenario you’re shooting. You want to get these bulbs close to the subject because they’re not great at opening up spaces. Fluorescent lighting is used to light interiors and is more compact and cooler than tungsten or HMI lighting.Advantages of Fluorescent lights
High efficiency
Low power requirement
Low cost
Long lamp life
Cool
Capable of soft even lighting over a large area
LightweightDisadvantages of Fluorescent lights
Flicker
High CRI
Domestic tubes have low CRI & poor color rendition.LED
LED’s are more and more common on film sets. You can use batteries to power them. That makes them portable and sleek – no messy cabled needed. You can rig your own panels of LED lights to fit any space necessary as well. LED’s can also power Fresnel style lamp heads such as the Arri L-series.Advantages of LED light
Soft, even lighting
Pure light without UV-artifacts
High efficiency
Low power consumption, can be battery powered
Excellent dimming by means of pulse width modulation control
Long lifespan
Environmentally friendly
Insensitive to shock
No risk of explosionDisadvantages of LED light
High cost.
LED’s are currently still expensive for their total light output -
Tracing Spherical harmonics and how Weta used them in production
Read more: Tracing Spherical harmonics and how Weta used them in productionA way to approximate complex lighting in ultra realistic renders.
All SH lighting techniques involve replacing parts of standard lighting equations with spherical functions that have been projected into frequency space using the spherical harmonics as a basis.
http://www.cs.columbia.edu/~cs4162/slides/spherical-harmonic-lighting.pdf
Spherical harmonics as used at Weta Digital
https://www.fxguide.com/fxfeatured/the-science-of-spherical-harmonics-at-weta-digital/
-
Photography basics: Solid Angle measures
Read more: Photography basics: Solid Angle measureshttp://www.calculator.org/property.aspx?name=solid+angle

A measure of how large the object appears to an observer looking from that point. Thus. A measure for objects in the sky. Useful to retuen the size of the sun and moon… and in perspective, how much of their contribution to lighting. Solid angle can be represented in ‘angular diameter’ as well.
http://en.wikipedia.org/wiki/Solid_angle
http://www.mathsisfun.com/geometry/steradian.html
A solid angle is expressed in a dimensionless unit called a steradian (symbol: sr). By default in terms of the total celestial sphere and before atmospheric’s scattering, the Sun and the Moon subtend fractional areas of 0.000546% (Sun) and 0.000531% (Moon).
http://en.wikipedia.org/wiki/Solid_angle#Sun_and_Moon
On earth the sun is likely closer to 0.00011 solid angle after athmospheric scattering. The sun as perceived from earth has a diameter of 0.53 degrees. This is about 0.000064 solid angle.
http://www.numericana.com/answer/angles.htm
The mean angular diameter of the full moon is 2q = 0.52° (it varies with time around that average, by about 0.009°). This translates into a solid angle of 0.0000647 sr, which means that the whole night sky covers a solid angle roughly one hundred thousand times greater than the full moon.
More info
http://lcogt.net/spacebook/using-angles-describe-positions-and-apparent-sizes-objects
http://amazing-space.stsci.edu/glossary/def.php.s=topic_astronomy
Angular Size
The apparent size of an object as seen by an observer; expressed in units of degrees (of arc), arc minutes, or arc seconds. The moon, as viewed from the Earth, has an angular diameter of one-half a degree.
The angle covered by the diameter of the full moon is about 31 arcmin or 1/2°, so astronomers would say the Moon’s angular diameter is 31 arcmin, or the Moon subtends an angle of 31 arcmin.


COLLECTIONS
| Featured AI
| Design And Composition
| Explore posts
POPULAR SEARCHES
unreal | pipeline | virtual production | free | learn | photoshop | 360 | macro | google | nvidia | resolution | open source | hdri | real-time | photography basics | nuke
FEATURED POSTS
-
Top 3D Printing Website Resources
-
Types of Film Lights and their efficiency – CRI, Color Temperature and Luminous Efficacy
-
Photography basics: Production Rendering Resolution Charts
-
What the Boeing 737 MAX’s crashes can teach us about production business – the effects of commoditisation
-
Emmanuel Tsekleves – Writing Research Papers
-
Image rendering bit depth
-
Yann Lecun: Meta AI, Open Source, Limits of LLMs, AGI & the Future of AI | Lex Fridman Podcast #416
-
Glossary of Lighting Terms – cheat sheet
Social Links
DISCLAIMER – Links and images on this website may be protected by the respective owners’ copyright. All data submitted by users through this site shall be treated as freely available to share.
