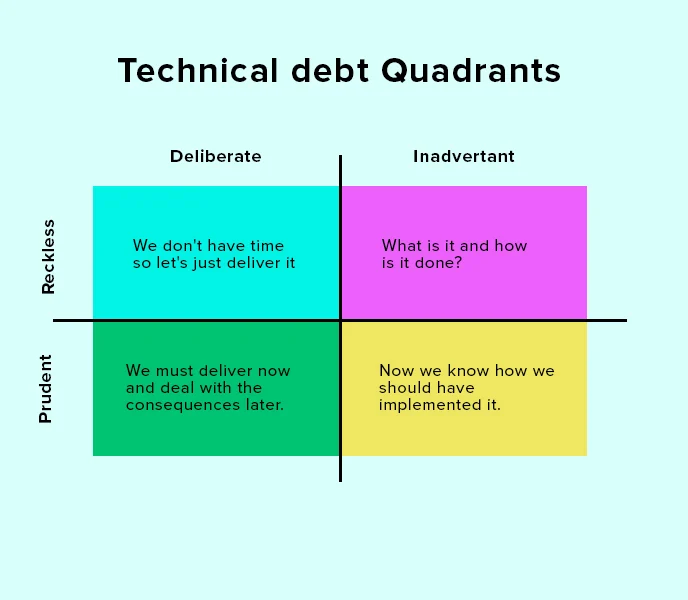
Full table in the post!

3Dprinting (178) A.I. (833) animation (348) blender (206) colour (233) commercials (52) composition (152) cool (361) design (646) Featured (79) hardware (311) IOS (109) jokes (138) lighting (288) modeling (144) music (186) photogrammetry (189) photography (754) production (1287) python (91) quotes (496) reference (314) software (1350) trailers (305) ves (549) VR (221)
The human eye perceives half scene brightness not as the linear 50% of the present energy (linear nature values) but as 18% of the overall brightness. We are biased to perceive more information in the dark and contrast areas. A Macbeth chart helps with calibrating back into a photographic capture into this “human perspective” of the world.
https://en.wikipedia.org/wiki/Middle_gray
In photography, painting, and other visual arts, middle gray or middle grey is a tone that is perceptually about halfway between black and white on a lightness scale in photography and printing, it is typically defined as 18% reflectance in visible light
Light meters, cameras, and pictures are often calibrated using an 18% gray card[4][5][6] or a color reference card such as a ColorChecker. On the assumption that 18% is similar to the average reflectance of a scene, a grey card can be used to estimate the required exposure of the film.
https://en.wikipedia.org/wiki/ColorChecker
The exposure meter in the camera does not know whether the subject itself is bright or not. It simply measures the amount of light that comes in, and makes a guess based on that. The camera will aim for 18% gray independently, meaning if you take a photo of an entirely white surface, and an entirely black surface you should get two identical images which both are gray (at least in theory). Thus enters the Macbeth chart.
<!–more–>
Note that Chroma Key Green is reasonably close to an 18% gray reflectance.
http://www.rags-int-inc.com/PhotoTechStuff/MacbethTarget/
https://upload.wikimedia.org/wikipedia/commons/b/b4/CIE1931xy_ColorChecker_SMIL.svg
RGB coordinates of the Macbeth ColorChecker
https://pdfs.semanticscholar.org/0e03/251ad1e6d3c3fb9cb0b1f9754351a959e065.pdf
1: Introduction Title: Managing a VFX Facility’s Render Wall
2: Daily Overview Title: Daily Management Routine
3: Resource Allocation Title: Efficient Resource Management
4: Job Prioritization Title: Prioritizing Rendering Tasks
5: Queue Optimization and Reporting Title: Streamlining Render Queues
6: Conclusion Title: Enhancing VFX Workflow
The terms 8-bit, 16-bit, 16-bit float, and 32-bit refer to different data formats used to store and represent image information, as bits per pixel.
https://en.wikipedia.org/wiki/Color_depth
In color technology, color depth also known as bit depth, is either the number of bits used to indicate the color of a single pixel, OR the number of bits used for each color component of a single pixel.
When referring to a pixel, the concept can be defined as bits per pixel (bpp).
When referring to a color component, the concept can be defined as bits per component, bits per channel, bits per color (all three abbreviated bpc), and also bits per pixel component, bits per color channel or bits per sample (bps). Modern standards tend to use bits per component, but historical lower-depth systems used bits per pixel more often.
Color depth is only one aspect of color representation, expressing the precision with which the amount of each primary can be expressed; the other aspect is how broad a range of colors can be expressed (the gamut). The definition of both color precision and gamut is accomplished with a color encoding specification which assigns a digital code value to a location in a color space.
Here’s a simple explanation of each.
8-bit images (i.e. 24 bits per pixel for a color image) are considered Low Dynamic Range.
They can store around 5 stops of light and each pixel carry a value from 0 (black) to 255 (white).
As a comparison, DSLR cameras can capture ~12-15 stops of light and they use RAW files to store the information.
16-bit: This format is commonly referred to as “half-precision.” It uses 16 bits of data to represent color values for each pixel. With 16 bits, you can have 65,536 discrete levels of color, allowing for relatively high precision and smooth gradients. However, it has a limited dynamic range, meaning it cannot accurately represent extremely bright or dark values. It is commonly used for regular images and textures.
16-bit float: This format is an extension of the 16-bit format but uses floating-point numbers instead of fixed integers. Floating-point numbers allow for more precise calculations and a larger dynamic range. In this case, the 16 bits are used to store both the color value and the exponent, which controls the range of values that can be represented. The 16-bit float format provides better accuracy and a wider dynamic range than regular 16-bit, making it useful for high-dynamic-range imaging (HDRI) and computations that require more precision.
32-bit: (i.e. 96 bits per pixel for a color image) are considered High Dynamic Range. This format, also known as “full-precision” or “float,” uses 32 bits to represent color values and offers the highest precision and dynamic range among the three options. With 32 bits, you have a significantly larger number of discrete levels, allowing for extremely accurate color representation, smooth gradients, and a wide range of brightness values. It is commonly used for professional rendering, visual effects, and scientific applications where maximum precision is required.
Bits and HDR coverage
High Dynamic Range (HDR) images are designed to capture a wide range of luminance values, from the darkest shadows to the brightest highlights, in order to reproduce a scene with more accuracy and detail. The bit depth of an image refers to the number of bits used to represent each pixel’s color information. When comparing 32-bit float and 16-bit float HDR images, the drop in accuracy primarily relates to the precision of the color information.
A 32-bit float HDR image offers a higher level of precision compared to a 16-bit float HDR image. In a 32-bit float format, each color channel (red, green, and blue) is represented by 32 bits, allowing for a larger range of values to be stored. This increased precision enables the image to retain more details and subtleties in color and luminance.
On the other hand, a 16-bit float HDR image utilizes 16 bits per color channel, resulting in a reduced range of values that can be represented. This lower precision leads to a loss of fine details and color nuances, especially in highly contrasted areas of the image where there are significant differences in luminance.
The drop in accuracy between 32-bit and 16-bit float HDR images becomes more noticeable as the exposure range of the scene increases. Exposure range refers to the span between the darkest and brightest areas of an image. In scenes with a limited exposure range, where the luminance differences are relatively small, the loss of accuracy may not be as prominent or perceptible. These images usually are around 8-10 exposure levels.
However, in scenes with a wide exposure range, such as a landscape with deep shadows and bright highlights, the reduced precision of a 16-bit float HDR image can result in visible artifacts like color banding, posterization, and loss of detail in both shadows and highlights. The image may exhibit abrupt transitions between tones or colors, which can appear unnatural and less realistic.
To provide a rough estimate, it is often observed that exposure values beyond approximately ±6 to ±8 stops from the middle gray (18% reflectance) may be more prone to accuracy issues in a 16-bit float format. This range may vary depending on the specific implementation and encoding scheme used.
To summarize, the drop in accuracy between 32-bit and 16-bit float HDR images is mainly related to the reduced precision of color information. This decrease in precision becomes more apparent in scenes with a wide exposure range, affecting the representation of fine details and leading to visible artifacts in the image.
In practice, this means that exposure values beyond a certain range will experience a loss of accuracy and detail when stored in a 16-bit float format. The exact range at which this loss occurs depends on the encoding scheme and the specific implementation. However, in general, extremely bright or extremely dark values that fall outside the representable range may be subject to quantization errors, resulting in loss of detail, banding, or other artifacts.
HDRs used for lighting purposes are usually slightly convolved to improve on sampling speed and removing specular artefacts. To that extent, 16 bit float HDRIs tend to me most used in CG cycles.
The 10 most powerful techniques:
1. Communicate the Why
2. Explain the context (strategy, data)
3. Clearly state your objectives
4. Specify the key results (desired outcomes)
5. Provide an example or template
6. Define roles and use the thinking hats
7. Set constraints and limitations
8. Provide step-by-step instructions (CoT)
9. Ask to reverse-engineer the result to get a prompt
10. Use markdown or XML to clearly separate sections (e.g., examples)
Top 10 high-ROI use cases for PMs:
1. Get new product ideas
2. Identify hidden assumptions
3. Plan the right experiments
4. Summarize a customer interview
5. Summarize a meeting
6. Social listening (sentiment analysis)
7. Write user stories
8. Generate SQL queries for data analysis
9. Get help with PRD and other templates
10. Analyze your competitors
Quick prompting scheme:
1- pass an image to JoyCaption
https://www.pixelsham.com/2024/12/23/joy-caption-alpha-two-free-automatic-caption-of-images/
2- tune the caption with ChatGPT as suggested by Pixaroma:
Craft detailed prompts for Al (image/video) generation, avoiding quotation marks. When I provide a description or image, translate it into a prompt that captures a cinematic, movie-like quality, focusing on elements like scene, style, mood, lighting, and specific visual details. Ensure that the prompt evokes a rich, immersive atmosphere, emphasizing textures, depth, and realism. Always incorporate (static/slow) camera or cinematic movement to enhance the feeling of fluidity and visual storytelling. Keep the wording precise yet descriptive, directly usable, and designed to achieve a high-quality, film-inspired result.
https://www.reddit.com/r/ChatGPT/comments/139mxi3/chatgpt_created_this_guide_to_prompt_engineering/
1. Use the 80/20 principle to learn faster
Prompt: “I want to learn about [insert topic]. Identify and share the most important 20% of learnings from this topic that will help me understand 80% of it.”
2. Learn and develop any new skill
Prompt: “I want to learn/get better at [insert desired skill]. I am a complete beginner. Create a 30-day learning plan that will help a beginner like me learn and improve this skill.”
3. Summarize long documents and articles
Prompt: “Summarize the text below and give me a list of bullet points with key insights and the most important facts.” [Insert text]
4. Train ChatGPT to generate prompts for you
Prompt: “You are an AI designed to help [insert profession]. Generate a list of the 10 best prompts for yourself. The prompts should be about [insert topic].”
5. Master any new skill
Prompt: “I have 3 free days a week and 2 months. Design a crash study plan to master [insert desired skill].”
6. Simplify complex information
Prompt: “Break down [insert topic] into smaller, easier-to-understand parts. Use analogies and real-life examples to simplify the concept and make it more relatable.”
More suggestions under the post…
(more…)Display Referred it is tied to the target hardware, as such it bakes color requirements into every type of media output request.
Scene Referred uses a common unified wide gamut and targeting audience through CDL and DI libraries instead.
So that color information stays untouched and only “transformed” as/when needed.
Sources:
– Victor Perez – Color Management Fundamentals & ACES Workflows in Nuke
– https://z-fx.nl/ColorspACES.pdf
– Wicus
“Simon Willison created a Datasette browser to explore WebVid-10M, one of the two datasets used to train the video generation model, and quickly learned that all 10.7 million video clips were scraped from Shutterstock, watermarks and all.”
“In addition to the Shutterstock clips, Meta also used 10 million video clips from this 100M video dataset from Microsoft Research Asia. It’s not mentioned on their GitHub, but if you dig into the paper, you learn that every clip came from over 3 million YouTube videos.”
“It’s become standard practice for technology companies working with AI to commercially use datasets and models collected and trained by non-commercial research entities like universities or non-profits.”
“Like with the artists, photographers, and other creators found in the 2.3 billion images that trained Stable Diffusion, I can’t help but wonder how the creators of those 3 million YouTube videos feel about Meta using their work to train their new model.”
nofilmschool.com/types-of-film-lights
“Not every light performs the same way. Lights and lighting are tricky to handle. You have to plan for every circumstance. But the good news is, lighting can be adjusted. Let’s look at different factors that affect lighting in every scene you shoot. ”
Use CRI, Luminous Efficacy and color temperature controls to match your needs.
Color Temperature
Color temperature describes the “color” of white light by a light source radiated by a perfect black body at a given temperature measured in degrees Kelvin
https://www.pixelsham.com/2019/10/18/color-temperature/
CRI
“The Color Rendering Index is a measurement of how faithfully a light source reveals the colors of whatever it illuminates, it describes the ability of a light source to reveal the color of an object, as compared to the color a natural light source would provide. The highest possible CRI is 100. A CRI of 100 generally refers to a perfect black body, like a tungsten light source or the sun. ”
https://www.studiobinder.com/blog/what-is-color-rendering-index/
https://en.wikipedia.org/wiki/Color_rendering_index
Light source | CCT (K) | CRI |
---|---|---|
Low-pressure sodium (LPS/SOX) | 1800 | −44 |
Clear mercury-vapor | 6410 | 17 |
High-pressure sodium (HPS/SON) | 2100 | 24 |
Coated mercury-vapor | 3600 | 49 |
Halophosphate warm-white fluorescent | 2940 | 51 |
Halophosphate cool-white fluorescent | 4230 | 64 |
Tri-phosphor warm-white fluorescent | 2940 | 73 |
Halophosphate cool-daylight fluorescent | 6430 | 76 |
“White” SON | 2700 | 82 |
Standard LED Lamp | 2700–5000 | 83 |
Quartz metal halide | 4200 | 85 |
Tri-phosphor cool-white fluorescent | 4080 | 89 |
High-CRI LED lamp (blue LED) | 2700–5000 | 95 |
Ceramic discharge metal-halide lamp | 5400 | 96 |
Ultra-high-CRI LED lamp (violet LED) | 2700–5000 | 99 |
Incandescent/halogen bulb | 3200 | 100 |
Luminous Efficacy
Luminous efficacy is a measure of how well a light source produces visible light, watts out versus watts in, measured in lumens per watt. In other words it is a measurement that indicates the ability of a light source to emit visible light using a given amount of power. It is a ratio of the visible energy to the power that goes into the bulb.
FILM LIGHT TYPES
Consumer light types
Tungsten Lights
Light interiors and match domestic places or office locations. Daylight.
Advantages of Tungsten Lights
Almost perfect color rendition
Low cost
Does not use mercury like CFLs (fluorescent) or mercury vapor lights
Better color temperature than standard tungsten
Longer life than a conventional incandescent
Instant on to full brightness, no warm-up time, and it is dimmable
Disadvantages of Tungsten Lights
Extremely hot
High power requirement
The lamp is sensitive to oils and cannot be touched
The bulb is capable of blowing and sending hot glass shards outward. A screen or layer of glass on the outside of the lamp can protect users.
Hydrargyrum medium-arc iodide lights
HMI’s are used when high output is required. They are also used to recreate sun shining through windows or to fake additional sun while shooting exteriors. HMIs can light huge areas at once.
Advantages of HMI lights
High light output
Higher efficiency
High color temperature
Disadvantages of HMI lights:
High cost
High power requirement
Dims only to about 50%
the color temperature increases with dimming
HMI bulbs will explode is dropped and release toxic chemicals
Fluorescent
Fluorescent film lighting is achieved by laying multiple tubes next to each other, combining as many as you want for the desired brightness. The good news is you can choose your bulbs to either be warm or cool depending on the scenario you’re shooting. You want to get these bulbs close to the subject because they’re not great at opening up spaces. Fluorescent lighting is used to light interiors and is more compact and cooler than tungsten or HMI lighting.
Advantages of Fluorescent lights
High efficiency
Low power requirement
Low cost
Long lamp life
Cool
Capable of soft even lighting over a large area
Lightweight
Disadvantages of Fluorescent lights
Flicker
High CRI
Domestic tubes have low CRI & poor color rendition.
LED
LED’s are more and more common on film sets. You can use batteries to power them. That makes them portable and sleek – no messy cabled needed. You can rig your own panels of LED lights to fit any space necessary as well. LED’s can also power Fresnel style lamp heads such as the Arri L-series.
Advantages of LED light
Soft, even lighting
Pure light without UV-artifacts
High efficiency
Low power consumption, can be battery powered
Excellent dimming by means of pulse width modulation control
Long lifespan
Environmentally friendly
Insensitive to shock
No risk of explosion
Disadvantages of LED light
High cost.
LED’s are currently still expensive for their total light output
https://www.freecodecamp.org/news/advanced-computer-vision-with-python
https://www.freecodecamp.org/news/how-to-use-opencv-and-python-for-computer-vision-and-ai
Working for a VFX (Visual Effects) studio provides numerous opportunities to leverage the power of Python and OpenCV for various tasks. OpenCV is a versatile computer vision library that can be applied to many aspects of the VFX pipeline. Here’s a detailed list of opportunities to take advantage of Python and OpenCV in a VFX studio:
Interpolating frames from an EXR sequence using OpenCV can be useful when you have only every second frame of a final render and you want to create smoother motion by generating intermediate frames. However, keep in mind that interpolating frames might not always yield perfect results, especially if there are complex changes between frames. Here’s a basic example of how you might use OpenCV to achieve this:
import cv2 import numpy as np import os # Replace with the path to your EXR frames exr_folder = "path_to_exr_frames" # Replace with the appropriate frame extension and naming convention frame_template = "frame_{:04d}.exr" # Define the range of frame numbers you have start_frame = 1 end_frame = 100 step = 2 # Define the output folder for interpolated frames output_folder = "output_interpolated_frames" os.makedirs(output_folder, exist_ok=True) # Loop through the frame range and interpolate for frame_num in range(start_frame, end_frame + 1, step): frame_path = os.path.join(exr_folder, frame_template.format(frame_num)) next_frame_path = os.path.join(exr_folder, frame_template.format(frame_num + step)) if os.path.exists(frame_path) and os.path.exists(next_frame_path): frame = cv2.imread(frame_path, cv2.IMREAD_ANYDEPTH | cv2.IMREAD_COLOR) next_frame = cv2.imread(next_frame_path, cv2.IMREAD_ANYDEPTH | cv2.IMREAD_COLOR) # Interpolate frames using simple averaging interpolated_frame = (frame + next_frame) / 2 # Save interpolated frame output_path = os.path.join(output_folder, frame_template.format(frame_num)) cv2.imwrite(output_path, interpolated_frame) print(f"Interpolated frame {frame_num}") # alternatively: print("Interpolated frame {}".format(frame_num))
Please note the following points:
To measure the contrast ratio you will need a light meter. The process starts with you measuring the main source of light, or the key light.
Get a reading from the brightest area on the face of your subject. Then, measure the area lit by the secondary light, or fill light. To make sense of what you have just measured you have to understand that the information you have just gathered is in F-stops, a measure of light. With each additional F-stop, for example going one stop from f/1.4 to f/2.0, you create a doubling of light. The reverse is also true; moving one stop from f/8.0 to f/5.6 results in a halving of the light.
Let’s say you grabbed a measurement from your key light of f/8.0. Then, when you measured your fill light area, you get a reading of f/4.0. This will lead you to a contrast ratio of 4:1 because there are two stops between f/4.0 and f/8.0 and each stop doubles the amount of light. In other words, two stops x twice the light per stop = four times as much light at f/8.0 than at f/4.0.
theslantedlens.com/2017/lighting-ratios-photo-video/
Examples in the post
5.10 of this tool includes excellent tools to clean up cr2 and cr3 used on set to support HDRI processing.
Converting raw to AcesCG 32 bit tiffs with metadata.
www.andreageremia.it/tutorial_python_tcl.html
https://www.gatimedia.co.uk/list-of-knobs-2
https://learn.foundry.com/nuke/developers/63/ndkdevguide/knobs-and-handles/knobtypes.html
http://www.andreageremia.it/tutorial_python_tcl.html
http://thoughtvfx.blogspot.com/2012/12/nuke-tcl-tips.html
Check final image quality
https://www.compositingpro.com/tech-check-compositing-shot-in-nuke/
Local copy:
http://pixelsham.com/wp-content/uploads/2023/03/compositing_pro_tech_check_nuke_script.nk
Nuke tcl procedures
https://www.gatimedia.co.uk/nuke-tcl-procedures
Knobs
https://learn.foundry.com/nuke/developers/63/ndkdevguide/knobs-and-handles/knobtypes.html
(more…)
Also see: https://www.pixelsham.com/2015/05/16/how-aperture-shutter-speed-and-iso-affect-your-photos/
In photography, exposure value (EV) is a number that represents a combination of a camera’s shutter speed and f-number, such that all combinations that yield the same exposure have the same EV (for any fixed scene luminance).
The EV concept was developed in an attempt to simplify choosing among combinations of equivalent camera settings. Although all camera settings with the same EV nominally give the same exposure, they do not necessarily give the same picture. EV is also used to indicate an interval on the photographic exposure scale. 1 EV corresponding to a standard power-of-2 exposure step, commonly referred to as a stop
EV 0 corresponds to an exposure time of 1 sec and a relative aperture of f/1.0. If the EV is known, it can be used to select combinations of exposure time and f-number.
Note EV does not equal to photographic exposure. Photographic Exposure is defined as how much light hits the camera’s sensor. It depends on the camera settings mainly aperture and shutter speed. Exposure value (known as EV) is a number that represents the exposure setting of the camera.
Thus, strictly, EV is not a measure of luminance (indirect or reflected exposure) or illuminance (incidental exposure); rather, an EV corresponds to a luminance (or illuminance) for which a camera with a given ISO speed would use the indicated EV to obtain the nominally correct exposure. Nonetheless, it is common practice among photographic equipment manufacturers to express luminance in EV for ISO 100 speed, as when specifying metering range or autofocus sensitivity.
The exposure depends on two things: how much light gets through the lenses to the camera’s sensor and for how long the sensor is exposed. The former is a function of the aperture value while the latter is a function of the shutter speed. Exposure value is a number that represents this potential amount of light that could hit the sensor. It is important to understand that exposure value is a measure of how exposed the sensor is to light and not a measure of how much light actually hits the sensor. The exposure value is independent of how lit the scene is. For example a pair of aperture value and shutter speed represents the same exposure value both if the camera is used during a very bright day or during a dark night.
Each exposure value number represents all the possible shutter and aperture settings that result in the same exposure. Although the exposure value is the same for different combinations of aperture values and shutter speeds the resulting photo can be very different (the aperture controls the depth of field while shutter speed controls how much motion is captured).
EV 0.0 is defined as the exposure when setting the aperture to f-number 1.0 and the shutter speed to 1 second. All other exposure values are relative to that number. Exposure values are on a base two logarithmic scale. This means that every single step of EV – plus or minus 1 – represents the exposure (actual light that hits the sensor) being halved or doubled.
https://www.streetdirectory.com/travel_guide/141307/photography/exposure_value_ev_and_exposure_compensation.html
https://en.wikipedia.org/wiki/Exposure_value
https://www.scantips.com/lights/math.html
which means 2EV = N² / t
where
EV 0 corresponds to an exposure time of 1 sec and an aperture of f/1.0.
Example: If f/16 and 1/4 second, then this is:
(N² / t) = (16 × 16 ÷ 1/4) = (16 × 16 × 4) = 1024.
Log₂(1024) is EV 10. Meaning, 210 = 1024.
The exposure meter in the camera does not know whether the subject itself is bright or not. It simply measures the amount of light that comes in, and makes a guess based on that. The camera will aim for 18% gray, meaning if you take a photo of an entirely white surface, and an entirely black surface you should get two identical images which both are gray (at least in theory)
https://en.wikipedia.org/wiki/Light_meter
For reflected-light meters, camera settings are related to ISO speed and subject luminance by the reflected-light exposure equation:
where
For incident-light meters, camera settings are related to ISO speed and subject illuminance by the incident-light exposure equation:
where
Two values for K are in common use: 12.5 (Canon, Nikon, and Sekonic) and 14 (Minolta, Kenko, and Pentax); the difference between the two values is approximately 1/6 EV.
For C a value of 250 is commonly used.
Nonetheless, it is common practice among photographic equipment manufacturers to also express luminance in EV for ISO 100 speed. Using K = 12.5, the relationship between EV at ISO 100 and luminance L is then :
L = 2(EV-3)
The situation with incident-light meters is more complicated than that for reflected-light meters, because the calibration constant C depends on the sensor type. Illuminance is measured with a flat sensor; a typical value for C is 250 with illuminance in lux. Using C = 250, the relationship between EV at ISO 100 and illuminance E is then :
E = 2.5 * 2(EV)
https://nofilmschool.com/2018/03/want-easier-and-faster-way-calculate-exposure-formula
Three basic factors go into the exposure formula itself instead: aperture, shutter, and ISO. Plus a light meter calibration constant.
f-stop²/shutter (in seconds) = lux * ISO/C
If you at least know four of those variables, you’ll be able to calculate the missing value.
So, say you want to figure out how much light you’re going to need in order to shoot at a certain f-stop. Well, all you do is plug in your values (you should know the f-stop, ISO, and your light meter calibration constant) into the formula below:
lux = C (f-stop²/shutter (in seconds))/ISO
Exposure Value Calculator:
https://snapheadshots.com/resources/exposure-and-light-calculator
https://www.scantips.com/lights/exposurecalc.html
https://www.pointsinfocus.com/tools/exposure-settings-ev-calculator/#google_vignette
From that perspective, an exposure stop is a measurement of Exposure and provides a universal linear scale to measure the increase and decrease in light, exposed to the image sensor, due to changes in shutter speed, iso & f-stop.
+-1 stop is a doubling or halving of the amount of light let in when taking a photo.
1 EV is just another way to say one stop of exposure change.
One major use of EV (Exposure Value) is just to measure any change of exposure, where one EV implies a change of one stop of exposure. Like when we compensate our picture in the camera.
If the picture comes out too dark, our manual exposure could correct the next one by directly adjusting one of the three exposure controls (f/stop, shutter speed, or ISO). Or if using camera automation, the camera meter is controlling it, but we might apply +1 EV exposure compensation (or +1 EV flash compensation) to make the result goal brighter, as desired. This use of 1 EV is just another way to say one stop of exposure change.
On a perfect day the difference from sampling the sky vs the sun exposure with diffusing spot meters is about 3.2 exposure difference.
~15.4 EV for the sun ~12.2 EV for the sky
That is as a ballpark. All still influenced by surroundings, accuracy parameters, fov of the sensor…
EV calculator
https://www.scantips.com/lights/evchart.html#calc
http://www.fredparker.com/ultexp1.htm
Exposure value is basically used to indicate an interval on the photographic exposure scale, with a difference of 1 EV corresponding to a standard power-of-2 exposure step, also commonly referred to as a “stop”.
https://contrastly.com/a-guide-to-understanding-exposure-value-ev/
All you can hope to measure with your camera and some images is the relative reflected luminance. Even if you have the camera settings. https://en.wikipedia.org/wiki/Relative_luminance
If you REALLY want to know the amount of light in absolute radiometric units, you’re going to need to use some kind of absolute light meter or measured light source to calibrate your camera. For references on how to do this, see: Section 2.5 Obtaining Absolute Radiance from http://www.pauldebevec.com/Research/HDR/debevec-siggraph97.pdf
IF you are still trying to gauge relative brightness, the level of the sun in Nuke can vary, but it should be in the thousands. Ie: between 30,000 and 65,0000 rgb value depending on time of the day, season and atmospherics.
The values for a 12 o’clock sun, with the sun sampled at EV 15.5 (shutter 1/30, ISO 100, F22) is 32.000 RGB max values (or 32,000 pixel luminance).
The thing to keep an eye for is the level of contrast between sunny side/fill side. The terminator should be quite obvious, there can be up to 3 stops difference between fill/key in sunny lit objects.
Note: In Foundry’s Nuke, the software will map 18% gray to whatever your center f/stop is set to in the viewer settings (f/8 by default… change that to EV by following the instructions below).
You can experiment with this by attaching an Exposure node to a Constant set to 0.18, setting your viewer read-out to Spotmeter, and adjusting the stops in the node up and down. You will see that a full stop up or down will give you the respective next value on the aperture scale (f8, f11, f16 etc.).
One stop doubles or halves the amount or light that hits the filmback/ccd, so everything works in powers of 2.
So starting with 0.18 in your constant, you will see that raising it by a stop will give you .36 as a floating point number (in linear space), while your f/stop will be f/11 and so on.
If you set your center stop to 0 (see below) you will get a relative readout in EVs, where EV 0 again equals 18% constant gray.
Note: make sure to set your Nuke read node to ‘raw data’
In other words. Setting the center f-stop to 0 means that in a neutral plate, the middle gray in the macbeth chart will equal to exposure value 0. EV 0 corresponds to an exposure time of 1 sec and an aperture of f/1.0.
To switch Foundry’s Nuke’s SpotMeter to return the EV of an image, click on the main viewport, and then press s, this opens the viewer’s properties. Now set the center f-stop to 0 in there. And the SpotMeter in the viewport will change from aperture and fstops to EV.
If you are trying to gauge the EV from the pixel luminance in the image:
– Setting the center f-stop to 0 means that in a neutral plate, the middle 18% gray will equal to exposure value 0.
– So if EV 0 = 0.18 middle gray in nuke which equal to a pixel luminance of 0.18, doubling that value, doubles the EV.
.18 pixel luminance = 0EV .36 pixel luminance = 1EV .72 pixel luminance = 2EV 1.46 pixel luminance = 3EV ...
This is a Geometric Progression function: xn = ar(n-1)
The most basic example of this function is 1,2,4,8,16,32,… The sequence starts at 1 and doubles each time, so
And we get:
{a, ar, ar2, ar3, … }
= {1, 1×2, 1×22, 1×23, … }
= {1, 2, 4, 8, … }
In this example the function translates to: n = 2(n-1)
You can graph this curve through this expression: x = 2(y-1) :
You can go back and forth between the two values through a geometric progression function and a log function:
(Note: in a spreadsheet this is: = POWER(2; cell# -1) and =LOG(cell#, 2)+1) )
2(y-1) | log2(x)+1 |
x | y |
1 | 1 |
2 | 2 |
4 | 3 |
8 | 4 |
16 | 5 |
32 | 6 |
64 | 7 |
128 | 8 |
256 | 9 |
512 | 10 |
1024 | 11 |
2048 | 12 |
4096 | 13 |
Translating this into a geometric progression between an image pixel luminance and EV:
www.hdrlabs.com/picturenaut/plugins.html
Note. The Median Cut algorithm is typically used for color quantization, which involves reducing the number of colors in an image while preserving its visual quality. It doesn’t directly provide a way to identify the brightest areas in an image. However, if you’re interested in identifying the brightest areas, you might want to look into other methods like thresholding, histogram analysis, or edge detection, through openCV for example.
Here is an openCV example:
# bottom left coordinates = 0,0 import numpy as np import cv2 # Load the HDR or EXR image image = cv2.imread('your_image_path.exr', cv2.IMREAD_UNCHANGED) # Load as-is without modification # Calculate the luminance from the HDR channels (assuming RGB format) luminance = np.dot(image[..., :3], [0.299, 0.587, 0.114]) # Set a threshold value based on estimated EV threshold_value = 2.4 # Estimated threshold value based on 4.8 EV # Apply the threshold to identify bright areas # Theluminance
array contains the calculated luminance values for each pixel in the image. # Thethreshold_value
is a user-defined value that represents a cutoff point, separating "bright" and "dark" areas in terms of perceived luminance.
thresholded = (luminance > threshold_value) * 255 # Convert the thresholded image to uint8 for contour detection thresholded = thresholded.astype(np.uint8) # Find contours of the bright areas contours, _ = cv2.findContours(thresholded, cv2.RETR_EXTERNAL, cv2.CHAIN_APPROX_SIMPLE) # Create a list to store the bounding boxes of bright areas bright_areas = [] # Iterate through contours and extract bounding boxes for contour in contours: x, y, w, h = cv2.boundingRect(contour) # Adjust y-coordinate based on bottom-left origin y_bottom_left_origin = image.shape[0] - (y + h) bright_areas.append((x, y_bottom_left_origin, x + w, y_bottom_left_origin + h)) # Store as (x1, y1, x2, y2) # Print the identified bright areas print("Bright Areas (x1, y1, x2, y2):") for area in bright_areas: print(area)
More details
Luminance and Exposure in an EXR Image:
The luminance line is calculating the luminance of each pixel in the image using a weighted sum of the red, green, and blue channels. The three float values [0.299, 0.587, 0.114] are the weights used to perform this calculation.
These weights are based on the concept of luminosity, which aims to approximate the perceived brightness of a color by taking into account the human eye’s sensitivity to different colors. The values are often derived from the NTSC (National Television System Committee) standard, which is used in various color image processing operations.
Here’s the breakdown of the float values:
The weighted sum of these channels helps create a grayscale image where the pixel values represent the perceived brightness. This technique is often used when converting a color image to grayscale or when calculating luminance for certain operations, as it takes into account the human eye’s sensitivity to different colors.
For the threshold, remember that the exact relationship between EV values and pixel values can depend on the tone-mapping or normalization applied to the HDR image, as well as the dynamic range of the image itself.
To establish a relationship between exposure and the threshold value, you can consider the relationship between linear and logarithmic scales:
threshold_value = base_value * (2 ** EV)
Here, EV
is the exposure value, base_value
is a scaling factor that determines the relationship between EV and threshold_value, and 2 ** EV
is used to convert the logarithmic EV to a linear intensity value.
base_value
factor should be determined based on the dynamic range of your EXR image and the specific luminance values you are dealing with.base_value
to achieve the desired separation of bright areas from the rest of the image.
Let’s say you have an EXR image with a dynamic range of 12 EV, which is a common range for many high dynamic range images. In this case, you want to set a threshold value that corresponds to a certain number of EV above the middle gray level (which is often considered to be around 0.18).
Here’s an example of how you might determine a base_value
to achieve this:
# Define the dynamic range of the image in EV dynamic_range = 12 # Choose the desired number of EV above middle gray for thresholding desired_ev_above_middle_gray = 2 # Calculate the threshold value based on the desired EV above middle gray threshold_value = 0.18 * (2 ** (desired_ev_above_middle_gray / dynamic_range)) print("Threshold Value:", threshold_value)
Chris is now using Google’s Looker Studio (this may better help those that aren’t able to use the filters on the spreadsheet):
https://lookerstudio.google.com/u/0/reporting/2f39b56e-7393-4aa2-9fd5-bf8bf615c95f/page/5koHB
Older format: docs.google.com/spreadsheets/d/1eR2oAXOuflr8CZeGoz3JTrsgNj3KuefbdXJOmNtjEVM/edit#gid=0
For any studios that would like to add positions to this, please feel free to use the following form:
https://docs.google.com/forms/d/e/1FAIpQLSeXziY3GQ8N7bxM-GxwDoZ7AimguHru0105PLVQtNYygswIlw/viewform
The 300dpi digital poster is now available to all PixelSham.com subscribers.
If you have already subscribed and wish a copy, please send me a note through the contact page.
https://www.copypastecharacter.com
https://www.freecodecamp.org/news/alt-codes-special-characters-keyboard-symbols-windows-list/
Most used ones:
Alt + 0149 • bullet point
Alt + 0153 ™ trademark symbol
Alt + 0169 © copyright symbol
Alt + 0174 ® registered trademark symbol
Alt + 0176 ° degree symbol
Alt + 0177 ± plus-or-minus sign
Alt + 0215 × multiplication sign
Alt + 12 ♀ female sign
Alt + 11 ♂ male sign
Alt + 13 ♪ eighth note
Alt + 14 ♫ beamed eighth note
Alt + 251 √ square root check mark
Alt + 8236 ∞ infinity
Alt + 24 ↑ up arrow
Alt + 25 ↓ down arrow
Alt + 26 → right arrow
Alt + 27 ← left arrow
Alt + 29 ↔ left right arrow
Alt + 94 ^
All of them:
૱ ꠸ ┯ ┰ ┱ ┲ ❗ ► ◄ Ă ă 0 1 2 3 4 5 6 7 8 9 Ǖ ǖ Ꞁ ¤ Ð ¢ ℥ Ω ℧ K ℶ ℷ ℸ ⅇ ⅊ ⚌ ⚍ ⚎ ⚏ ⚭ ⚮ ⌀ ⏑ ⏒ ⏓ ⏔ ⏕ ⏖ ⏗ ⏘ ⏙ ⏠ ⏡ ⏦ ᶀ ᶁ ᶂ ᶃ ᶄ ᶆ ᶇ ᶈ ᶉ ᶊ ᶋ ᶌ ᶍ ᶎ ᶏ ᶐ ᶑ ᶒ ᶓ ᶔ ᶕ ᶖ ᶗ ᶘ ᶙ ᶚ ᶸ ᵯ ᵰ ᵴ ᵶ ᵹ ᵼ ᵽ ᵾ ᵿ ⁁ ⁊ ⸜ ⸝ ¶ ¥ £ ⅕ ⅙ ⅛ ⅔ ⅖ ⅗ ⅘ ⅜ ⅚ ⅐ ⅝ ↉ ⅓ ⅑ ⅒ ⅞ ← ↑ → ↓ ↔ ↕ ↖ ↗ ↘ ↙ ↚ ↛ ↜ ↝ ↞ ↟ ↠ ↡ ↢ ↣ ↤ ↥ ↦ ↧ ↨ ↩ ↪ ↫ ↬ ↭ ↮ ↯ ↰ ↱ ↲ ↳ ↴ ↵ ↶ ↷ ↸ ↹ ↺ ↻ ↼ ↽ ↾ ↿ ⇀ ⇁ ⇂ ⇃ ⇄ ⇅ ⇆ ⇇ ⇈ ⇉ ⇊ ⇋ ⇌ ⇍ ⇎ ⇏ ⇐ ⇑ ⇒ ⇓ ⇔ ⇕ ⇖ ⇗ ⇘ ⇙ ⇚ ⇛ ⇜ ⇝ ⇞ ⇟ ⇠ ⇡ ⇢ ⇣ ⇤ ⇥ ⇦ ⇨ ⇩ ⇪ ⇧ ⇫ ⇬ ⇭ ⇮ ⇯ ⇰ ⇱ ⇲ ⇳ ⇴ ⇵ ⇶ ⇷ ⇸ ⇹ ⇺ ⇻ ⇼ ⇽ ⇾ ⇿ ⟰ ⟱ ⟲ ⟳ ⟴ ⟵ ⟶ ⟷ ⟸ ⟹ ⟺ ⟻ ⟼ ⟽ ⟾ ⟿ ⤀ ⤁ ⤂ ⤃ ⤄ ⤅ ⤆ ⤇ ⤈ ⤉ ⤊ ⤋ ⤌ ⤍ ⤎ ⤏ ⤐ ⤑ ⤒ ⤓ ⤔ ⤕ ⤖ ⤗ ⤘ ⤙ ⤚ ⤛ ⤜ ⤝ ⤞ ⤟ ⤠ ⤡ ⤢ ⤣ ⤤ ⤥ ⤦ ⤧ ⤨ ⤩ ⤪ ⤫ ⤬ ⤭ ⤮ ⤯ ⤰ ⤱ ⤲ ⤳ ⤴ ⤵ ⤶ ⤷ ⤸ ⤹ ⤺ ⤻ ⤼ ⤽ ⤾ ⤿ ⥀ ⥁ ⥂ ⥃ ⥄ ⥅ ⥆ ⥇ ⥈ ⥉ ⥊ ⥋ ⥌ ⥍ ⥎ ⥏ ⥐ ⥑ ⥒ ⥓ ⥔ ⥕ ⥖ ⥗ ⥘ ⥙ ⥚ ⥛ ⥜ ⥝ ⥞ ⥟ ⥠ ⥡ ⥢ ⥣ ⥤ ⥥ ⥦ ⥧ ⥨ ⥩ ⥪ ⥫ ⥬ ⥭ ⥮ ⥯ ⥰ ⥱ ⥲ ⥳ ⥴ ⥵ ⥶ ⥷ ⥸ ⥹ ⥺ ⥻ ⥼ ⥽ ⥾ ⥿ ➔ ➘ ➙ ➚ ➛ ➜ ➝ ➞ ➝ ➞ ➟ ➠ ➡ ➢ ➣ ➤ ➥ ➦ ➧ ➨ ➩ ➩ ➪ ➫ ➬ ➭ ➮ ➯ ➱ ➲ ➳ ➴ ➵ ➶ ➷ ➸ ➹ ➺ ➻ ➼ ➽ ➾ ⬀ ⬁ ⬂ ⬃ ⬄ ⬅ ⬆ ⬇ ⬈ ⬉ ⬊ ⬋ ⬌ ⬍ ⬎ ⬏ ⬐ ⬑ ☇ ☈ ⏎ ⍃ ⍄ ⍅ ⍆ ⍇ ⍈ ⍐ ⍗ ⍌ ⍓ ⍍ ⍔ ⍏ ⍖ ♾ ⎌ ☊ ☋ ☌ ☍ ⌃ ⌄ ⌤ ⌅ ⌆ ⌇ ⚋ ⚊ ⌌ ⌍ ⌎ ⌏ ⌐ ⌑ ⌔ ⌕ ⌗ ⌙ ⌢ ⌣ ⌯ ⌬ ⌭ ⌮ ⌖ ⌰ ⌱ ⌲ ⌳ ⌴ ⌵ ⌶ ⌷ ⌸ ⌹ ⌺ ⌻ ⌼ ⍯ ⍰ ⌽ ⌾ ⌿ ⍀ ⍁ ⍂ ⍉ ⍊ ⍋ ⍎ ⍏ ⍑ ⍒ ⍕ ⍖ ⍘ ⍙ ⍚ ⍛ ⍜ ⍝ ⍞ ⍠ ⍟ ⍡ ⍢ ⍣ ⍤ ⍥ ⍨ ⍩ ⍦ ⍧ ⍬ ⍿ ⍪ ⍮ ⍫ ⍱ ⍲ ⍭ ⍳ ⍴ ⍵ ⍶ ⍷ ⍸ ⍹ ⍺ ⍼ ⍽ ⍾ ⎀ ⎁ ⎂ ⎃ ⎄ ⎅ ⎆ ⎉ ⎊ ⎋ ⎍ ⎎ ⎏ ⎐ ⎑ ⎒ ⎓ ⎔ ⎕ ⏣ ⌓ ⏥ ⏢ ⎖ ⎲ ⎳ ⎴ ⎵ ⎶ ⎸ ⎹ ⎺ ⎻ ⎼ ⎽ ⎾ ⎿ ⏀ ⏁ ⏂ ⏃ ⏄ ⏅ ⏆ ⏇ ⏈ ⏉ ⏉ ⏋ ⏌ ⏍ ⏐ ⏤ ⏚ ⏛ Ⓝ ℰ ⓦ ! ⌘ « » ‹ › ‘ ’ “ ” „ ‚ ❝ ❞ £ ¥ € $ ¢ ¬ ¶ @ § ® © ™ ° × π ± √ ‰ Ω ∞ ≈ ÷ ~ ≠ ¹ ² ³ ½ ¼ ¾ ‐ – — | ⁄ \ [ ] { } † ‡ … · • ● ⌥ ⌃ ⇧ ↩ ¡ ¿ ‽ ⁂ ∴ ∵ ◊ ※ ← → ↑ ↓ ☜ ☞ ☝ ☟ ✔ ★ ☆ ♺ ☼ ☂ ☺ ☹ ☃ ✉ ✿ ✄ ✈ ✌ ✎ ♠ ♦ ♣ ♥ ♪ ♫ ♯ ♀ ♂ α ß Á á À à Å å Ä ä Æ æ Ç ç É é È è Ê ê Í í Ì ì Î î Ñ ñ Ó ó Ò ò Ô ô Ö ö Ø ø Ú ú Ù ù Ü ü Ž ž ₳ ฿ ¢ € ₡ ¢ ₢ ₵ ₫ £ £ ₤ ₣ ƒ ₲ ₭ ₥ ₦ ₱ $ $ ₮ ₩ ₩ ¥ ¥ ₴ ₰ ¤ ៛ ₪ ₯ ₠ ₧ ₨ ௹ ﷼ ㍐ ৲ ৳ ~ ƻ Ƽ ƽ ¹ ¸ ¬ ¨ ɂ ǁ ¯ Ɂ ǂ ¡ ´ ° ꟾ ¦ } { | . , · ] ) [ / _ \ ¿ º § ” * – + ( ! & % $ ¼ ¾ ½ ¶ © ® @ ẟ Ɀ ` Ȿ ^ ꜠ ꜡ ỻ ‘ = : ; < ꞌ Ꞌ ꞊ ꞁ ꞈ ꞉ > ? ÷ ℾ ℿ ℔ ℩ ℉ ⅀ ℈ þ ð Þ µ ª ꝋ ꜿ Ꜿ ⱽ ⱺ ⱹ ⱷ ⱶ Ⱶ ⱴ ⱱ Ɒ ⱦ ȶ ȴ ȣ Ȣ ȡ ȝ Ȝ ț ȋ Ȋ ȉ Ȉ ǯ Ǯ ǃ ǀ ƿ ƾ ƺ ƹ Ƹ Ʒ Ʋ ư ƪ ƣ Ƣ Ɵ ƛ Ɩ ƕ ƍ ſ ỽ ⸀ ⸁ ⸂ ⸃ ⸄ ⸅ ⸆ ⸇ ⸈ ⸉ ⸊ ⸋ ⸌ ⸍ ⸎ ⸏ ⸐ ⸑ ⸒ ⸔ ⸕ ▲ ▼ ◀ ▶ ◢ ◣ ◥ ◤ △ ▽ ◿ ◺ ◹ ◸ ▴ ▾ ◂ ▸ ▵ ▿ ◃ ▹ ◁ ▷ ◅ ▻ ◬ ⟁ ⧋ ⧊ ⊿ ∆ ∇ ◭ ◮ ⧩ ⧨ ⌔ ⟐ ◇ ◆ ◈ ⬖ ⬗ ⬘ ⬙ ⬠ ⬡ ⎔ ⋄ ◊ ⧫ ⬢ ⬣ ▰ ▪ ◼ ▮ ◾ ▗ ▖ ■ ∎ ▃ ▄ ▅ ▆ ▇ █ ▌ ▐ ▍ ▎ ▉ ▊ ▋ ❘ ❙ ❚ ▀ ▘ ▝ ▙ ▚ ▛ ▜ ▟ ▞ ░ ▒ ▓ ▂ ▁ ▬ ▔ ▫ ▯ ▭ ▱ ◽ □ ◻ ▢ ⊞ ⊡ ⊟ ⊠ ▣ ▤ ▥ ▦ ⬚ ▧ ▨ ▩ ⬓ ◧ ⬒ ◨ ◩ ◪ ⬔ ⬕ ❏ ❐ ❑ ❒ ⧈ ◰ ◱ ◳ ◲ ◫ ⧇ ⧅ ⧄ ⍁ ⍂ ⟡ ⧉ ⚬ ○ ⚪ ◌ ◍ ◎ ◯ ❍ ◉ ⦾ ⊙ ⦿ ⊜ ⊖ ⊘ ⊚ ⊛ ⊝ ● ⚫ ⦁ ◐ ◑ ◒ ◓ ◔ ◕ ⦶ ⦸ ◵ ◴ ◶ ◷ ⊕ ⊗ ⦇ ⦈ ⦉ ⦊ ❨ ❩ ⸨ ⸩ ◖ ◗ ❪ ❫ ❮ ❯ ❬ ❭ ❰ ❱ ⊏ ⊐ ⊑ ⊒ ◘ ◙ ◚ ◛ ◜ ◝ ◞ ◟ ◠ ◡ ⋒ ⋓ ⋐ ⋑ ╰ ╮ ╭ ╯ ⌒ ╳ ✕ ╱ ╲ ⧸ ⧹ ⌓ ◦ ❖ ✖ ✚ ✜
(more…)https://www.translatorscafe.com/unit-converter/en-US/illumination/1-11/
The power output of a light source is measured using the unit of watts W. This is a direct measure to calculate how much power the light is going to drain from your socket and it is not relatable to the light brightness itself.
The amount of energy emitted from it per second. That energy comes out in a form of photons which we can crudely represent with rays of light coming out of the source. The higher the power the more rays emitted from the source in a unit of time.
Not all energy emitted is visible to the human eye, so we often rely on photometric measurements, which takes in account the sensitivity of human eye to different wavelenghts
Details in the post
(more…)
You’ve been in the VFX Industry for over a decade. Tell us about your journey.
It all started with my older brother giving me a Commodore64 personal computer as a gift back in the late 80′. I realised then I could create something directly from my imagination using this new digital media format. And, eventually, make a living in the process.
That led me to start my professional career in 1990. From live TV to games to animation. All the way to live action VFX in the recent years.
I really never stopped to crave to create art since those early days. And I have been incredibly fortunate to work with really great talent along the way, which made my journey so much more effective.
What inspired you to pursue VFX as a career?
An incredible combination of opportunities, really. The opportunity to express myself as an artist and earn money in the process. The opportunity to learn about how the world around us works and how best solve problems. The opportunity to share my time with other talented people with similar passions. The opportunity to grow and adapt to new challenges. The opportunity to develop something that was never done before. A perfect storm of creativity that fed my continuous curiosity about life and genuinely drove my inspiration.
Tell us about the projects you’ve particularly enjoyed working on in your career
I quite enjoyed working on live TV projects, as the combination of tight deadlines and high quality was quite an incredible learning platform as a professional artist. But working on large, high end live action feature projects was really where I learnt most of my trade. And gave me the most satisfaction.
Every film I worked on had some memorable experiences. Right from Avatar to Iron Man 3 to Jungle Book to The Planet of the Apes to The Hobbits to name a few.
But above all, the technical challenges and the high quality we reached in each and every of the projects that I worked on, the best memories come from working with amazing and skilled artists, from a variety of disciplines. As those were my true mentors and became my best friends.
Post Production, Animation, VFX, Motion Graphics, Video Editing …
What are some technologies and trends that you think are emerging in the VFX Industry?
In the last few years there has definitely been a bias from some major studios to make VFX a commodity. In the more negative sense of the word. When any product reaches a level of quality that attracts a mass of consumers and reaches a plateau of opportunities, large corporation tend to respond with maximising its sale values by leveraging marketing schemes and deliverable more than the core values of the product itself. This is often a commoditisation approach that tends to empower agents who are not necessarily knowledgeable of a product’s cycles, and in that process, lowering the quality of the product itself for the sake of profits. It is a pretty common event in modern society and it applies to any brand name, not just VFX.
One challenge with VFX’s technology and artistry is that it relies on the effectiveness of artists and visionaries for the most. And limiting the authority, ownerships and perspective of such a crowd has definitely directly impacted the overall quality of the last decade of productions, both technically and artistically. There are very few and apart creative forces who have been able to deliver project that one could identify as a truly creative breakthrough. While the majority of productions seem to have suffered from some of these commoditisation patterns.
The other bigger challenge with this current trend is that VFX, due to various, historical business arrangements, is often relying on unbalanced resources as well as very small and feeble economic cycles and margins. Which make the entire industry extremely susceptible to marketing failures and to unstable leadership. As a few recent bankruptcies have demonstrated.
It is taking some reasonable time for the VFX crowd to acknowledge these trends and learn to be profitable, as the majority has never been educated on fair business practices.
But. Thankfully, the VFX circle is also a crowd of extremely adaptable and talented individuals, who are quite capable at resolving issues, finding alternatives and leveraging their passion. Which I believe is one of the drives behind the current evolution in the use of artificial intelligence, virtual reality, virtual production, real time rendering, and so on.
There is still a long path ahead of us but I hope we are all learning ways to make our passion speaks in profitable ways for everyone.
It is also highly likely that, in a near future, larger software and hardware corporation, thanks to their more profitable business practices, large development teams and better understanding of marketing, will eventually take over a lot of the cycles that the current production houses currently run. And in that process allow creative studios to focus back on VFX artistry.
What effect has the pandemics-induced lockdown had on the industry?
It is still early to say. I fear that if live action production does not start soon, we may see some of the economic challenges I mention above. At both studio and artists’ scale. There is definitely a push from production houses to make large distribution clients understand the fragility of the moment, especially in relation to payment cycles and economic support. Thus, there is still a fair risk that the few studios which adopted a more commoditised view to production will make their artists pay some price for their choices.
But, any challenge brings opportunities. For example, there is finally some recognition into a momentum to rely on work-from-home as a feasible solution to a lot of the current office production’s limitations and general artistry restrictions. Which, while there is no win-win in this pandemic, could be a silver lining.
What would you say to the budding artists who wish to become CG artists or VFX professionals?
Follow your passion but treat this career as any other business.
Learn to be adaptable. Find a true balance between professional and family life. Carefully plan your future. And watch our channel to learn more about all these.
What inspired you to create a channel for aspiring artists?
As many fellow and respected artists, I love this industry, but I had to understand a lot of business practices at my own expenses.
You can learn tools, cycles and software from books and schools. But production life tends to drive its own rhythms and there are fewer opportunities to absorb those.
Along my career I had some challenges finding professional willing to share their time to invest into me. But I was still extremely fortunate to find other mentors who helped me to be economically and professionally successful in this business. I owe a lot to these people. I promised myself I would exchange that favour by helping other artists, myself.
What can students expect to learn from your channel?
I am excited to have the opportunity to fill some of the voids that the current education systems and industry may have. This by helping new artists with true life stories by some of the most accomplished and successful talents I met during my career. We will talk about technology trends as much as our life experiences as artists. Discussing career advises. Trying to look into the future of the industry. And suggesting professional tips. The aim through this mentor-ship is to inspire new generations to focus on what is more important for the VFX industry. Take responsibilities for their art and passions as much as their families.
And, in the process, to feel empowered to materialise from their imagination more and more of those creative, awe inspiring moments that this art form has gifted us with so far.
Resolution – Aspect Ratio | 4:03 | 16:09 | 16:10 | 3:02 | 5:03 | 5:04 |
CGA | 320 x 200 | |||||
QVGA | 320 x 240 | |||||
VGA (SD, Standard Definition) | 640 x 480 | |||||
NTSC | 720 x 480 | |||||
WVGA | 854 x 450 | |||||
WVGA | 800 x 480 | |||||
PAL | 768 x 576 | |||||
SVGA | 800 x 600 | |||||
XGA | 1024 x 768 | |||||
not named | 1152 x 768 | |||||
HD 720 (720P, High Definition) | 1280 x 720 | |||||
WXGA | 1280 x 800 | |||||
WXGA | 1280 x 768 | |||||
SXGA | 1280 x 1024 | |||||
not named (768P, HD, High Definition) | 1366 x 768 | |||||
not named | 1440 x 960 | |||||
SXGA+ | 1400 x 1050 | |||||
WSXGA | 1680 x 1050 | |||||
UXGA (2MP) | 1600 x 1200 | |||||
HD1080 (1080P, Full HD) | 1920 x 1080 | |||||
WUXGA | 1920 x 1200 | |||||
2K | 2048 x (any) | |||||
QWXGA | 2048 x 1152 | |||||
QXGA (3MP) | 2048 x 1536 | |||||
WQXGA | 2560 x 1600 | |||||
QHD (Quad HD) | 2560 x 1440 | |||||
QSXGA (5MP) | 2560 x 2048 | |||||
4K UHD (4K, Ultra HD, Ultra-High Definition) | 3840 x 2160 | |||||
QUXGA+ | 3840 x 2400 | |||||
IMAX 3D | 4096 x 3072 | |||||
8K UHD (8K, 8K Ultra HD, UHDTV) | 7680 x 4320 | |||||
10K (10240×4320, 10K HD) | 10240 x (any) | |||||
16K (Quad UHD, 16K UHD, 8640P) | 15360 x 8640 |
http://www.calculator.org/property.aspx?name=solid+angle
A measure of how large the object appears to an observer looking from that point. Thus. A measure for objects in the sky. Useful to retuen the size of the sun and moon… and in perspective, how much of their contribution to lighting. Solid angle can be represented in ‘angular diameter’ as well.
http://en.wikipedia.org/wiki/Solid_angle
http://www.mathsisfun.com/geometry/steradian.html
A solid angle is expressed in a dimensionless unit called a steradian (symbol: sr). By default in terms of the total celestial sphere and before atmospheric’s scattering, the Sun and the Moon subtend fractional areas of 0.000546% (Sun) and 0.000531% (Moon).
http://en.wikipedia.org/wiki/Solid_angle#Sun_and_Moon
On earth the sun is likely closer to 0.00011 solid angle after athmospheric scattering. The sun as perceived from earth has a diameter of 0.53 degrees. This is about 0.000064 solid angle.
http://www.numericana.com/answer/angles.htm
The mean angular diameter of the full moon is 2q = 0.52° (it varies with time around that average, by about 0.009°). This translates into a solid angle of 0.0000647 sr, which means that the whole night sky covers a solid angle roughly one hundred thousand times greater than the full moon.
More info
http://lcogt.net/spacebook/using-angles-describe-positions-and-apparent-sizes-objects
http://amazing-space.stsci.edu/glossary/def.php.s=topic_astronomy
Angular Size
The apparent size of an object as seen by an observer; expressed in units of degrees (of arc), arc minutes, or arc seconds. The moon, as viewed from the Earth, has an angular diameter of one-half a degree.
The angle covered by the diameter of the full moon is about 31 arcmin or 1/2°, so astronomers would say the Moon’s angular diameter is 31 arcmin, or the Moon subtends an angle of 31 arcmin.
EDIT 2023 : Unfortunately, due to the rise of AI driven scraping, I had to take the youtube channel down.
I am excited to officially announce the release of a new YouTube channel dedicated to help and support digital artists in the feature production business!
We will be interviewing some of the most successful senior artists and supervisors in the feature digital art business. This project with the intent of providing artists in the industry with experiences and personal suggestions that can help our careers and success in this art form.
Please, visit us for more information and latest interviews.
Javascript VS Python
https://www.freecodecamp.org/news/python-vs-javascript-what-are-the-key-differences-between-the-two-popular-programming-languages/
Built in functions
https://developer.mozilla.org/en-US/docs/Web/JavaScript/Reference
https://htmlcheatsheet.com/js/
www.digitalocean.com/community/tutorial_series/how-to-code-in-javascript
www.codecademy.com/catalog/language/javascript
https://websitesetup.org/wp-content/uploads/2018/04/wsu-js-cheat-sheet.pdf
https://ilovecoding.org/blog/js-cheatsheet
https://javascriptobfuscator.com/Javascript-Obfuscator.aspx
https://htmlcheatsheet.com/js/
https://www.freecodecamp.org/news/how-to-manipulate-the-dom-beginners-guide/
en.wikipedia.org/wiki/Go_motion
Petroleum jelly
This crude but reasonably effective technique involves smearing petroleum jelly (“Vaseline”) on a plate of glass in front of the camera lens, also known as vaselensing, then cleaning and reapplying it after each shot — a time-consuming process, but one which creates a blur around the model. This technique was used for the endoskeleton in The Terminator. This process was also employed by Jim Danforth to blur the pterodactyl’s wings in Hammer Films’ When Dinosaurs Ruled the Earth, and by Randal William Cook on the terror dogs sequence in Ghostbusters.[citation needed]
Bumping the puppet
Gently bumping or flicking the puppet before taking the frame will produce a slight blur; however, care must be taken when doing this that the puppet does not move too much or that one does not bump or move props or set pieces.
Moving the table
Moving the table on which the model is standing while the film is being exposed creates a slight, realistic blur. This technique was developed by Ladislas Starevich: when the characters ran, he moved the set in the opposite direction. This is seen in The Little Parade when the ballerina is chased by the devil. Starevich also used this technique on his films The Eyes of the Dragon, The Magical Clock and The Mascot. Aardman Animations used this for the train chase in The Wrong Trousers and again during the lorry chase in A Close Shave. In both cases the cameras were moved physically during a 1-2 second exposure. The technique was revived for the full-length Wallace & Gromit: The Curse of the Were-Rabbit.
Go motion
The most sophisticated technique was originally developed for the film The Empire Strikes Back and used for some shots of the tauntauns and was later used on films like Dragonslayer and is quite different from traditional stop motion. The model is essentially a rod puppet. The rods are attached to motors which are linked to a computer that can record the movements as the model is traditionally animated. When enough movements have been made, the model is reset to its original position, the camera rolls and the model is moved across the table. Because the model is moving during shots, motion blur is created.
A variation of go motion was used in E.T. the Extra-Terrestrial to partially animate the children on their bicycles.
Airplane manufacturing is no different from mortgage lending or insulin distribution or make-believe blood analyzing software (or VFX?) —another cash cow for the one percent, bound inexorably for the slaughterhouse.
The beginning of the end was “Boeing’s 1997 acquisition of McDonnell Douglas, a dysfunctional firm with a dilapidated aircraft plant in Long Beach and a CEO (Harry Stonecipher) who liked to use what he called the “Hollywood model” for dealing with engineers: Hire them for a few months when project deadlines are nigh, fire them when you need to make numbers.” And all that came with it. “Stonecipher’s team had driven the last nail in the coffin of McDonnell’s flailing commercial jet business by trying to outsource everything but design, final assembly, and flight testing and sales.”
It is understood, now more than ever, that capitalism does half-assed things like that, especially in concert with computer software and oblivious regulators.
There was something unsettlingly familiar when the world first learned of MCAS in November, about two weeks after the system’s unthinkable stupidity drove the two-month-old plane and all 189 people on it to a horrific death. It smacked of the sort of screwup a 23-year-old intern might have made—and indeed, much of the software on the MAX had been engineered by recent grads of Indian software-coding academies making as little as $9 an hour, part of Boeing management’s endless war on the unions that once represented more than half its employees.
Down in South Carolina, a nonunion Boeing assembly line that opened in 2011 had for years churned out scores of whistle-blower complaints and wrongful termination lawsuits packed with scenes wherein quality-control documents were regularly forged, employees who enforced standards were sabotaged, and planes were routinely delivered to airlines with loose screws, scratched windows, and random debris everywhere.
Shockingly, another piece of the quality failure is Boeing securing investments from all airliners, starting with SouthWest above all, to guarantee Boeing’s production lines support in exchange for fair market prices and favorite treatments. Basically giving Boeing financial stability independently on the quality of their product. “Those partnerships were but one numbers-smoothing mechanism in a diversified tool kit Boeing had assembled over the previous generation for making its complex and volatile business more palatable to Wall Street.”
https://www.discovery.com/science/mexapixels-in-human-eye
About 576 megapixels for the entire field of view.
Consider a view in front of you that is 90 degrees by 90 degrees, like looking through an open window at a scene. The number of pixels would be:
90 degrees * 60 arc-minutes/degree * 1/0.3 * 90 * 60 * 1/0.3 = 324,000,000 pixels (324 megapixels).
At any one moment, you actually do not perceive that many pixels, but your eye moves around the scene to see all the detail you want. But the human eye really sees a larger field of view, close to 180 degrees. Let’s be conservative and use 120 degrees for the field of view. Then we would see:
120 * 120 * 60 * 60 / (0.3 * 0.3) = 576 megapixels.
Or.
7 megapixels for the 2 degree focus arc… + 1 megapixel for the rest.
https://clarkvision.com/articles/eye-resolution.html
Details in the post
Also see:
https://www.pixelsham.com/2018/11/22/exposure-value-measurements/
https://www.pixelsham.com/2016/03/03/f-stop-vs-t-stop/
An exposure stop is a unit measurement of Exposure as such it provides a universal linear scale to measure the increase and decrease in light, exposed to the image sensor, due to changes in shutter speed, iso and f-stop.
+-1 stop is a doubling or halving of the amount of light let in when taking a photo
1 EV (exposure value) is just another way to say one stop of exposure change.
https://www.photographymad.com/pages/view/what-is-a-stop-of-exposure-in-photography
Same applies to shutter speed, iso and aperture.
Doubling or halving your shutter speed produces an increase or decrease of 1 stop of exposure.
Doubling or halving your iso speed produces an increase or decrease of 1 stop of exposure.
Because of the way f-stop numbers are calculated (ratio of focal length/lens diameter, where focal length is the distance between the lens and the sensor), an f-stop doesn’t relate to a doubling or halving of the value, but to the doubling/halving of the area coverage of a lens in relation to its focal length. And as such, to a multiplying or dividing by 1.41 (the square root of 2). For example, going from f/2.8 to f/4 is a decrease of 1 stop because 4 = 2.8 * 1.41. Changing from f/16 to f/11 is an increase of 1 stop because 11 = 16 / 1.41.
A wider aperture means that light proceeding from the foreground, subject, and background is entering at more oblique angles than the light entering less obliquely.
Consider that absolutely everything is bathed in light, therefore light bouncing off of anything is effectively omnidirectional. Your camera happens to be picking up a tiny portion of the light that’s bouncing off into infinity.
Now consider that the wider your iris/aperture, the more of that omnidirectional light you’re picking up:
When you have a very narrow iris you are eliminating a lot of oblique light. Whatever light enters, from whatever distance, enters moderately parallel as a whole. When you have a wide aperture, much more light is entering at a multitude of angles. Your lens can only focus the light from one depth – the foreground/background appear blurred because it cannot be focused on.
https://frankwhitephotography.com/index.php?id=28:what-is-a-stop-in-photography
The great thing about stops is that they give us a way to directly compare shutter speed, aperture diameter, and ISO speed. This means that we can easily swap these three components about while keeping the overall exposure the same.
http://lifehacker.com/how-aperture-shutter-speed-and-iso-affect-pictures-sh-1699204484
https://www.techradar.com/how-to/the-exposure-triangle
https://www.videoschoolonline.com/what-is-an-exposure-stop
Note. All three of these measurements (aperture, shutter, iso) have full stops, half stops and third stops, but if you look at the numbers they aren’t always consistent. For example, a one third stop between ISO100 and ISO 200 would be ISO133, yet most cameras are marked at ISO125.
Third-stops are especially important as they’re the increment that most cameras use for their settings. These are just imaginary divisions in each stop.
From a practical standpoint manufacturers only standardize the full stops, meaning that while they try and stay somewhat consistent there is some rounding up going on between the smaller numbers.
Note that ND Filters directly modify the exposure triangle.
RASTERIZATION
Rasterisation (or rasterization) is the task of taking the information described in a vector graphics format OR the vertices of triangles making 3D shapes and converting them into a raster image (a series of pixels, dots or lines, which, when displayed together, create the image which was represented via shapes), or in other words “rasterizing” vectors or 3D models onto a 2D plane for display on a computer screen.
For each triangle of a 3D shape, you project the corners of the triangle on the virtual screen with some math (projective geometry). Then you have the position of the 3 corners of the triangle on the pixel screen. Those 3 points have texture coordinates, so you know where in the texture are the 3 corners. The cost is proportional to the number of triangles, and is only a little bit affected by the screen resolution.
In computer graphics, a raster graphics or bitmap image is a dot matrix data structure that represents a generally rectangular grid of pixels (points of color), viewable via a monitor, paper, or other display medium.
With rasterization, objects on the screen are created from a mesh of virtual triangles, or polygons, that create 3D models of objects. A lot of information is associated with each vertex, including its position in space, as well as information about color, texture and its “normal,” which is used to determine the way the surface of an object is facing.
Computers then convert the triangles of the 3D models into pixels, or dots, on a 2D screen. Each pixel can be assigned an initial color value from the data stored in the triangle vertices.
Further pixel processing or “shading,” including changing pixel color based on how lights in the scene hit the pixel, and applying one or more textures to the pixel, combine to generate the final color applied to a pixel.
The main advantage of rasterization is its speed. However, rasterization is simply the process of computing the mapping from scene geometry to pixels and does not prescribe a particular way to compute the color of those pixels. So it cannot take shading, especially the physical light, into account and it cannot promise to get a photorealistic output. That’s a big limitation of rasterization.
There are also multiple problems:
If you have two triangles one is behind the other, you will draw twice all the pixels. you only keep the pixel from the triangle that is closer to you (Z-buffer), but you still do the work twice.
The borders of your triangles are jagged as it is hard to know if a pixel is in the triangle or out. You can do some smoothing on those, that is anti-aliasing.
You have to handle every triangles (including the ones behind you) and then see that they do not touch the screen at all. (we have techniques to mitigate this where we only look at triangles that are in the field of view)
Transparency is hard to handle (you can’t just do an average of the color of overlapping transparent triangles, you have to do it in the right order)
RAY CASTING
It is almost the exact reverse of rasterization: you start from the virtual screen instead of the vector or 3D shapes, and you project a ray, starting from each pixel of the screen, until it intersect with a triangle.
The cost is directly correlated to the number of pixels in the screen and you need a really cheap way of finding the first triangle that intersect a ray. In the end, it is more expensive than rasterization but it will, by design, ignore the triangles that are out of the field of view.
You can use it to continue after the first triangle it hit, to take a little bit of the color of the next one, etc… This is useful to handle the border of the triangle cleanly (less jagged) and to handle transparency correctly.
RAYTRACING
Same idea as ray casting except once you hit a triangle you reflect on it and go into a different direction. The number of reflection you allow is the “depth” of your ray tracing. The color of the pixel can be calculated, based off the light source and all the polygons it had to reflect off of to get to that screen pixel.
The easiest way to think of ray tracing is to look around you, right now. The objects you’re seeing are illuminated by beams of light. Now turn that around and follow the path of those beams backwards from your eye to the objects that light interacts with. That’s ray tracing.
Ray tracing is eye-oriented process that needs walking through each pixel looking for what object should be shown there, which is also can be described as a technique that follows a beam of light (in pixels) from a set point and simulates how it reacts when it encounters objects.
Compared with rasterization, ray tracing is hard to be implemented in real time, since even one ray can be traced and processed without much trouble, but after one ray bounces off an object, it can turn into 10 rays, and those 10 can turn into 100, 1000…The increase is exponential, and the the calculation for all these rays will be time consuming.
Historically, computer hardware hasn’t been fast enough to use these techniques in real time, such as in video games. Moviemakers can take as long as they like to render a single frame, so they do it offline in render farms. Video games have only a fraction of a second. As a result, most real-time graphics rely on the another technique called rasterization.
PATH TRACING
Path tracing can be used to solve more complex lighting situations.
Path tracing is a type of ray tracing. When using path tracing for rendering, the rays only produce a single ray per bounce. The rays do not follow a defined line per bounce (to a light, for example), but rather shoot off in a random direction. The path tracing algorithm then takes a random sampling of all of the rays to create the final image. This results in sampling a variety of different types of lighting.
When a ray hits a surface it doesn’t trace a path to every light source, instead it bounces the ray off the surface and keeps bouncing it until it hits a light source or exhausts some bounce limit.
It then calculates the amount of light transferred all the way to the pixel, including any color information gathered from surfaces along the way.
It then averages out the values calculated from all the paths that were traced into the scene to get the final pixel color value.
It requires a ton of computing power and if you don’t send out enough rays per pixel or don’t trace the paths far enough into the scene then you end up with a very spotty image as many pixels fail to find any light sources from their rays. So when you increase the the samples per pixel, you can see the image quality becomes better and better.
Ray tracing tends to be more efficient than path tracing. Basically, the render time of a ray tracer depends on the number of polygons in the scene. The more polygons you have, the longer it will take.
Meanwhile, the rendering time of a path tracer can be indifferent to the number of polygons, but it is related to light situation: If you add a light, transparency, translucence, or other shader effects, the path tracer will slow down considerably.
blogs.nvidia.com/blog/2018/03/19/whats-difference-between-ray-tracing-rasterization/
https://en.wikipedia.org/wiki/Rasterisation
https://www.quora.com/Whats-the-difference-between-ray-tracing-and-path-tracing
Color Temperature of a light source describes the spectrum of light which is radiated from a theoretical “blackbody” (an ideal physical body that absorbs all radiation and incident light – neither reflecting it nor allowing it to pass through) with a given surface temperature.
https://en.wikipedia.org/wiki/Color_temperature
Or. Most simply it is a method of describing the color characteristics of light through a numerical value that corresponds to the color emitted by a light source, measured in degrees of Kelvin (K) on a scale from 1,000 to 10,000.
More accurately. The color temperature of a light source is the temperature of an ideal backbody that radiates light of comparable hue to that of the light source.
As such, the color temperature of a light source is a numerical measurement of its color appearance. It is based on the principle that any object will emit light if it is heated to a high enough temperature, and that the color of that light will shift in a predictable manner as the temperature is increased. The system is based on the color changes of a theoretical “blackbody radiator” as it is heated from a cold black to a white hot state.
So, why do we measure the hue of the light as a “temperature”? This was started in the late 1800s, when the British physicist William Kelvin heated a block of carbon. It glowed in the heat, producing a range of different colors at different temperatures. The black cube first produced a dim red light, increasing to a brighter yellow as the temperature went up, and eventually produced a bright blue-white glow at the highest temperatures. In his honor, Color Temperatures are measured in degrees Kelvin, which are a variation on Centigrade degrees. Instead of starting at the temperature water freezes, the Kelvin scale starts at “absolute zero,” which is -273 Centigrade.
More about black bodies here: https://www.pixelsham.com/2013/03/14/black-body-color
Details in the post
COLLECTIONS
| Featured AI
| Design And Composition
| Explore posts
POPULAR SEARCHES
unreal | pipeline | virtual production | free | learn | photoshop | 360 | macro | google | nvidia | resolution | open source | hdri | real-time | photography basics | nuke
FEATURED POSTS
Social Links
DISCLAIMER – Links and images on this website may be protected by the respective owners’ copyright. All data submitted by users through this site shall be treated as freely available to share.